
1
December 8, 2022
Private Passenger Auto
Artificial Intelligence/Machine Learning
Survey Results
NAIC Staff Report
NAIC SURVEY TECHNICAL TEAM
Kris DeFrain, Director of Research and Actuarial Services
Dorothy L. Andrews, Senior Behavioral Data Scientist and Actuary
Roberto Perez Santiago, Property/Casualty Rate Modeling Actuary and Data Scientist
Justin Cox, Data Analyst III
Paula D. Harms, Center for Insurance Policy and Research (CIPR) Senior Research Analyst

2
Table of Contents
INTRODUCTION ............................................................................................................................................. 5
BACKGROUND ............................................................................................................................................... 6
GENERAL SECTION OF THE SURVEY .............................................................................................................. 8
COMPANY OPERATION: CLAIMS ................................................................................................................. 10
COMPANY OPERATION: FRAUD DETECTION .............................................................................................. 15
COMPANY OPERATION: MARKETING ......................................................................................................... 20
COMPANY OPERATION: RATING ................................................................................................................. 24
COMPANY OPERATION: UNDERWRITING ................................................................................................... 29
COMPANY OPERATION: LOSS PREVENTION ............................................................................................... 33
CUSTOMER DATA CORRECTION .................................................................................................................. 37
GOVERNANCE ............................................................................................................................................. 40
THIRD-PARTY DATA SOURCES AND MODELS .............................................................................................. 43
REGULATORS’ ACCESS TO DATA: DASHBOARD .......................................................................................... 59
CONCLUSION/NEXT STEPS .......................................................................................................................... 60
APPENDIX A: Guidance for Questions in Each Operational Area: Rating, Underwriting, Claims,
Fraud Detection, Marketing, Loss Prevention ...................................................................................... 61
APPENDIX B: Definitions Specific to Claims ................................................................................................ 62
APPENDIX C: Definitions Specific to Fraud Detection ................................................................................. 63
APPENDIX D: Definitions Specific to Marketing .......................................................................................... 64
APPENDIX E: Definitions Specific to Rating ................................................................................................. 65
APPENDIX F: Definitions Specific to Underwriting ...................................................................................... 66
APPENDIX G: Definitions Specific to Loss Prevention ................................................................................. 67
APPENDIX H: Data Use Table (“Data Elements”) Definitions ...................................................................... 68
APPENDIX I: Model Governance Definitions ............................................................................................... 69

3
Index of Tables
Table 1: Companies Using or Exploring Use of AI/ML .................................................................................. 8
Table 2: Companies’ Reasons for Not Using AI/ML ...................................................................................... 9
Table 3: Companies with Models in Use or Under Construction by Insurer Operation Area ...................... 9
Table 4: Companies Use of Claims Models ................................................................................................. 11
Table 5: Level of Decision-Making by Use of Claims Models...................................................................... 11
Table 6: Claims Model Sources by Model Use ............................................................................................ 12
Table 7: Companies Use of Claims Data Elements ..................................................................................... 13
Table 8: Claims Model Sources (Internal vs. Third Party) by Data Elements .............................................. 13
Table 9: Companies’ Use of Consumer or Other Type of Score as an Input for Claims Data
Elements ..................................................................................................................................................... 14
Table 10: Companies Use of Fraud Detection Models ............................................................................... 15
Table 11: Level of Decision-Making by Use of Fraud Detection Models .................................................... 16
Table 12: Fraud Detection Model Sources by Model Use .......................................................................... 17
Table 13: Companies Use of Fraud Detection Data Elements .................................................................... 17
Table 14: Fraud Detection Model Sources (Internal vs. Third Party) by Data Elements ............................ 18
Table 15: Companies’ Use of Consumer or Other Type of Score as an Input for Fraud Detection
Data Elements ............................................................................................................................................. 19
Table 16: Companies Use of Marketing Models ......................................................................................... 20
Table 17: Level of Decision-Making by Use of Marketing Models ............................................................. 21
Table 18: Marketing Model Sources by Model Use .................................................................................... 21
Table 19: Companies Use of Marketing Data Elements ............................................................................. 22
Table 20: Marketing Model Sources (Internal vs. Third Party) by Data Elements...................................... 23
Table 22: Companies’ Use of Rating Models .............................................................................................. 25
Table 23: Level of Decision-Making by Use of Rating Models .................................................................... 25
Table 24: Rating Model Sources by Model Use .......................................................................................... 26
Table 25: Companies Use of Rating Data Elements .................................................................................... 26
Table 26: Rating Model Sources (Internal vs. Third Party) by Data Elements ............................................ 27
Table 27: Companies’ Use of Consumer or Other Type of Score as an Input for Rating Data
Elements ..................................................................................................................................................... 28
Table 28: Companies’ Use of Underwriting Models ................................................................................... 29
Table 29: Level of Decision-Making by Use of Underwriting Models ......................................................... 30
Table 30: Underwriting Model Sources by Model Use ............................................................................... 30
Table 31: Companies Use of Underwriting Data Elements ........................................................................ 31
Table 32: Underwriting Model Sources (Internal vs. Third Party) by Data Elements ................................. 32
Table 33: Companies’ Use of Consumer or Other Type of Score as an Input for Underwriting Data
Elements ..................................................................................................................................................... 33
Table 34: Companies Use of Claims Models ............................................................................................... 34
Table 35: Level of Decision-Making by Use of Loss Prevention Models ..................................................... 34
Table 36: Loss Prevention Model Sources by Model Use ........................................................................... 35
Table 37: Companies Use of Loss Prevention Data Elements .................................................................... 35
Table 38: Loss Prevention Model Sources (Internal vs. Third Party) by Data Elements ............................. 36

4
Table 39: Companies’ Use of Consumer or Other Type of Score as an Input for Loss Prevention
Data Elements ............................................................................................................................................. 37
Table 40: Companies’ Disclosure to Consumers about the Data Elements by Insurer Operation
Area ............................................................................................................................................................. 38
Table 41: Companies’ Disclosure to Consumers about the Purposes of Data Elements by Insurer
Operation Area ........................................................................................................................................... 38
Table 42: Consumers Ability to Correct Data by Insurer Operation Area .................................................. 39
Table 43: Governance Documentation of NAIC AI Principle: Fairness and Ethics Considerations ............. 40
Table 44: Governance Documentation of NAIC AI Principle: Accountability for Data Algorithms'
Compliance with Laws as well as Intended and Unintended Impacts ........................................................ 40
Table 45: Governance Documentation of NAIC AI Principle: Appropriate Resources and Knowledge
Involved to Ensure Compliance with Laws Including those Related to Unfair Discrimination ................... 41
Table 46: Governance Documentation of NAIC AI Principle: Ensure Transparency with Appropriate
Disclosures Including Notice to Consumers Specific to Data Being Used and Methods for Appeal
and Recourse Related to Inaccurate Data .................................................................................................. 41
Table 47: Governance Documentation of NAIC AI Principle: AI Systems are Secure, Safe and
Robust including Decision Traceability and Security and Privacy Risk Protections .................................... 41
Table 48: Companies Following Other Existing Standards or Guidance in Regard to a Governance
Framework .................................................................................................................................................. 42
Table 49: Source (Internal or External) of Other Existing Standards or Guidance in Regard to a
Governance Framework.............................................................................................................................. 42
Table 50: Existing Other Standards or Guidance in Regard to a Governance Framework ......................... 42
Table 51: Third Parties’ Claims Models Used by Insurers ........................................................................... 43
Table 52: Third Parties’ Claims Data Element Sources Used by Insurers ................................................... 45
Table 53: Third Parties’ Fraud Detection Models Used by Insurers ........................................................... 46
Table 54: Third Party Fraud Detection Data Element Sources Used by Insurers ....................................... 48
Table 55: Third Parties’ Marketing Models Used by Insurers .................................................................... 50
Table 56: Third Party Marketing Data Element Sources Used by Insurers ................................................. 52
Table 57: Third Parties’ Rating Models Used by Insurers ........................................................................... 55
Table 58: Third Party Rating Data Element Sources Used by Insurers ....................................................... 55
Table 59: Third Parties’ Underwriting Models Used by Insurers ................................................................ 57
Table 60: Third Party Underwriting Data Element Sources Used by Insurers ............................................ 57
Table 61: Third Parties’ Loss Prevention Models Used by Insurers ............................................................ 58
Table 62: Third Party Loss Prevention Data Element Sources Used by Insurers ........................................ 59

5
INTRODUCTION
Purpose of the Survey
At the outset of the Artificial Intelligence (AI)/Machine Learning (ML) surveys, the predecessor to the Big
Data and Artificial Intelligence (H) Working Group defined five key objectives. Regulators want to: 1) learn
directly from the industry about what is happening in this space; 2) get a sense of the current level of risk
and exposure and whether or how the industry is managing or mitigating that risk; 3) develop information
for trending, such as how the risk is evolving over time, and the industry’s responsive actions; 4) inform a
meaningful and useful regulatory approach, framework, and/or strategy for overseeing and monitoring
this activity; and 5) learn from prior surveys to inform and improve future surveys.
This Private Passenger Auto (PPA) survey is expected to help regulators in terms of 1) consumer
protections and 2) areas that regulators might expect companies involved in this type of activity to be,
actively and with intention, ensuring that they are putting processes and procedures in place to meet, or
at least consider, the expectations laid out in the NAIC’s AI Principles.
This initial survey was developed to document industry observations in the PPA insurance market
regarding use of data and AI/ML, gain insight from open-ended questions, get a good sense of the current
level of risk and exposure, and learn what companies be doing to mitigate and/or manage its risk and
exposure.
Purpose of Thi
s Report
With the tremendous amount of data submitted for this survey, the subject matter expert (SME) group
asked NAIC technical staff to assist in conducting a thorough analysis. The survey analysis team was asked
to evaluate the results, provide data analysis, and investigate potential inaccuracies in the data. The team
was specifically asked to investigate what types of data are being used by companies in their AI/ML
models; evaluate third-party AI/ML model and data use; explore levels of governance; and evaluate
transparency, consumer disclosures, and potential consumer actions to correct data.
Goals of the Private Passenger Auto Survey
1. Analyze industry use of artificial intelligence (AI)/machine learning
(ML).
2. Identify industry’s risk and exposure and mitigation of model risk.
3. Calculate trends.
4. Gather background for regulatory approach/framework.
5. Inform/improve future surveys.

6
BACKGROUND
The PPA survey was conducted under market conduct examination authority of nine states: Connecticut,
Illinois, Iowa, Louisiana, Nevada, North Dakota, Pennsylvania, Rhode Island, and Wisconsin. SMEs from
these states opted to limit the survey request to only larger companies, defined as those PPA writers with
more than $75 million in 2020 direct premium written. The survey call letter was distributed on Sept. 28,
2021, and survey responses were requested by Oct. 28, 2021. A total of 193 responses were received, and
almost 90% of those indicated they are doing something pertaining to AI/ML.
Survey Web Page
The survey template, filing documentation, frequently asked questions (FAQ), and a link to the submission
application can be found on the PPA AI/ML survey
web page.
Surveyed Companies and Requesting States
The PPA insurance companies with at least $75 million in 2020 direct written premium transacting ongoing
business in at least one of the following states were requested to provide survey responses within 30
days: Connecticut, Illinois, Iowa, Louisiana, Nevada, North Dakota, Pennsylvania, Rhode Island, or
Wisconsin (requesting states).
Nine states conducted a market conduct analysis of various property/casualty (P/C) companies to:
• Gain a better understanding of the insurance industry’s use and governance of big data and
AI/ML.
• Seek information that could aid in the development of guidance or a potential regulatory
framework to support the insurance industry’s use of big data and AI/ML.
• Inform as to the current and planned business practices of the company.
The requesting states agreed the collected data will not be used to evaluate or determine the company’s
compliance with applicable laws and regulations.
Regulatory Subject Matter Experts
For each of the requesting states, the following SMEs created the survey and will communicate the survey
responses to the Big Data and Artificial Intelligence (H) Working Group.
CT: George Bradner
IL: Erica Weyhenmeyer
IA: Andria Seip
LA: Nichole Torblaa
ND: Mike Andring and Chris Aufenthie
NV: Gennady Stolyarov
PA: Michael McKenney
RI: Matt Gendron
WI: Timothy Cornelius
The following NAIC staff assisted the SMEs with survey development, survey distribution, and data
collection: Denise Matthews, Tim Mullen, Teresa Cooper, Paula D. Harms, and Justin Cox.

7
Artificial Intelligence/Machine Learning Definition
The definition of AI/ML was provided on the PPA AI/ML survey web site with the following link:
PPA AI/ML
Filing Guidance & Definitions (Version 2021.0.0).
“Definition of Artificial Intelligence / Machine Learning (AI/ML) for Survey – Applicable to All Sections
AI/ML describes an automated process in which a system begins recognizing patterns without being
specifically programmed to achieve a predetermined result. This is different from a standard
algorithm in that an algorithm is a process or set of rules executed to solve an equation or problem in
a predetermined fashion. Evolving algorithms are considered a subset of AI/ML.
Artificial Intelligence/Machine Learning Systems include:
• Systems that adapt and adjust to new data and experience without manual human
intervention.
• Systems that arrive at results for which the outcomes and the stepwise approach toward the
outcomes were not configured in advance by a human programmer.
• Systems that dynamically respond to conditions in the external environment without the
specific nature of such responses being known in advance to the designers of the systems.
• Systems that utilize neural networks and/or deep-learning algorithms, such as supervised,
semi-supervised, and unsupervised learning algorithms.
• Systems that engage in automatic speech recognition, facial recognition, image recognition,
text recognition, natural language processing, generation of customer-specific
recommendations, automated customer communications (e.g., chatbots with non-
preprogrammed prompts), autonomous or semi-autonomous vehicle operation or data
gathering, or any other approach that does not require either preprogramming or a manual
human intervention in every instance of an action or decision.
• Systems that automatically generate adaptive responses based on interactions with a
consumer or third party.
• Systems that determine which data elements to rely upon, in a non-preprogrammed fashion,
among a variety of possible alternatives.
Artificial Intelligence/Machine Learning Systems exclude:
• Static “scorecards” that deterministically map consumer or other risk characteristics to
treatments or decisions. (However, an AI/ML system may use the output of such static
“scorecards” as input data for the AI/ML system to consider.)
• Systems with solely preprogrammed decision rules. (e.g., “If A, then B” applied invariably in
all situations).
• Tables of point or factor assignments in rating plans.
• Static ratemaking and/or predictive-modeling methodologies, including linear regression,
generalized linear modeling (GLM), or generalized additive modeling (GAM). Purely
informational static databases, such as databases used to obtain reference amounts for claim
settlements, or static databases pertaining to consumer characteristics or experience,
regardless of the amount of information in the database. However, if AI/ML is used to create
a static predictive model, that AI/ML system is considered within the scope of this survey.
8
• Deterministic “phone trees” that navigate consumers through prerecorded voice prompts.
• Any approach that a company could have realistically utilized in the year 2000 or prior.”
A key decision affecting interpretation of results was the definition of AI/ML for purposes of the survey.
The SME group drafted the AI/ML definition to exclude some methods, such as linear regression,
commonly used models such as GLM and GAMs, and any approach that a company could have realistically
used in the year 2000 or prior. The SMEs developed the AI/ML definition to focus on the “more advanced”
models. Regulators noted they have extensive experience reviewing the older models used for rating,
having completed the NAIC’s 2020 white paper Regulatory Review of Predictive Models and having
conducted numerous training and educational events.
This definition resulted in approximately 80% of the models used in rating, based on the types of models
submitted to the NAIC’s rate model review team, to be excluded from the survey results. We have no
information about the impact of this definition on the reporting of models for companies’ non-rating
operations. While there is some possibility of a mixed bag of data due to using a definition of AI/ML that
is not academically accepted, the SME regulators experienced with rating models said the answers appear
to reflect the requested definition accordingly. However, after the survey results were partially revealed,
Hartford employees said they are aware of the state of the AI/ML usage in the insurance industry and
believe the reporting of models exceed the expected number if the survey’s AI/ML definition had been
used by all reporting companies. This position is speculation and cannot be proven with the available data.
Regulators would need to delve deeper by asking the companies whether the definition was consistently
used across company operations.
Confidentiality
The individual company results are confidential. Some combined results have been publicly presented at
Big Data and Artificial Intelligence (H) Working Group meetings and are presented in this report.
GENERAL SECTION OF THE SURVEY
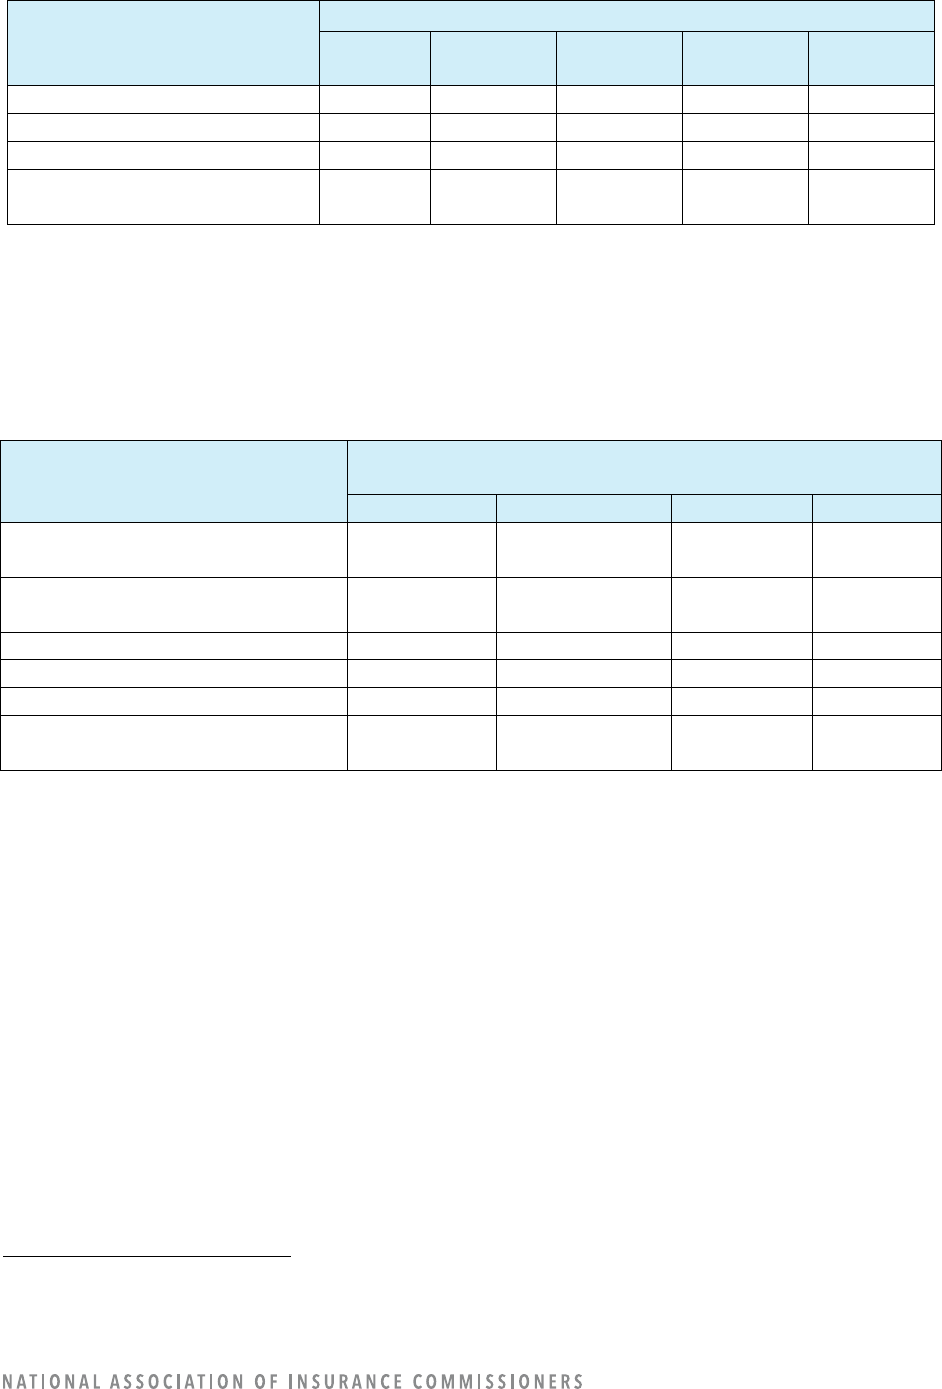
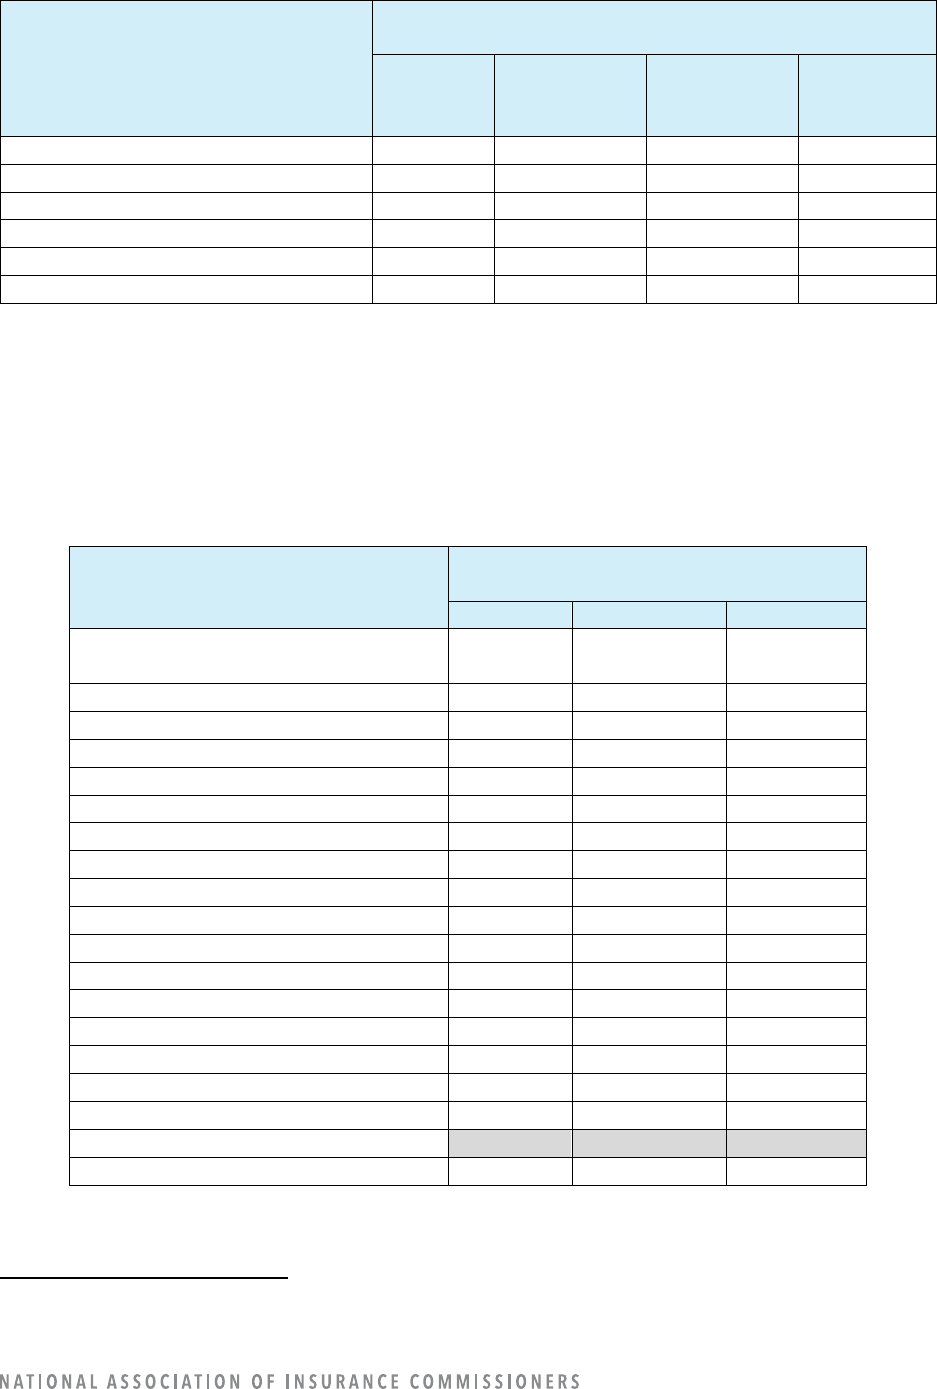
Out of 193 companies that completed the survey, 169 companies currently use, plan to use, or plan to
explore using AI / ML as defined for this survey. This equates to 88.6% of reporting companies. (Refer to
Table 1.)
Table 1: Companies Using or Exploring the Use of AI/ML
Number of Companies
Planning to Use or Explore
Using AI/ML
Yes
169
No
24
Total
193
The 24 companies that indicated they had no plan to use or explore use of AI/ML also provided their
reason(s) why, with the most often selected reasons being: 1) no compelling business reason; and 2) lack
of resources and expertise. In addition to the options listed in the survey and shown in Table 2, a few
companies wrote in additional reasons. One company said it was not convinced it will yield a better risk
9
selection and/or product pricing result. Three companies said they use preconfigured programming in
their business processes. One company said it does not currently have policies in the requesting states.
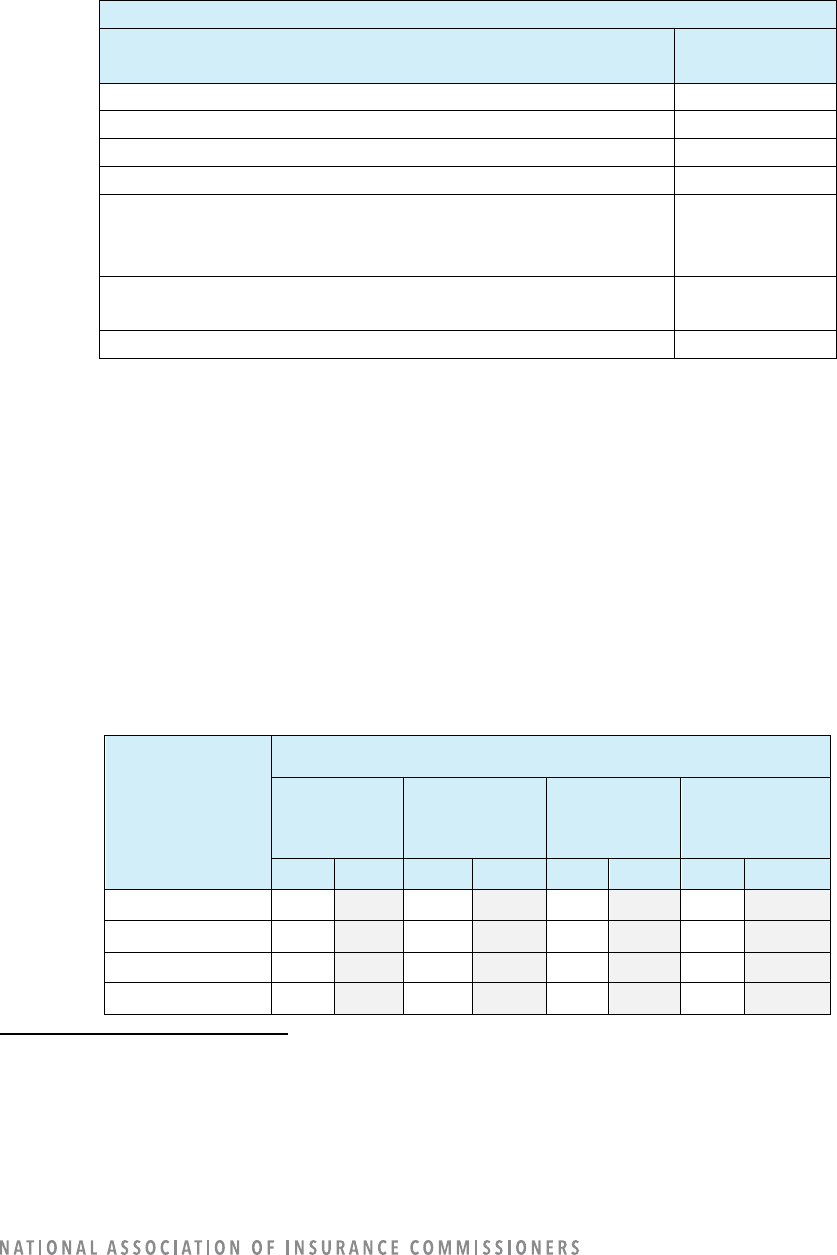
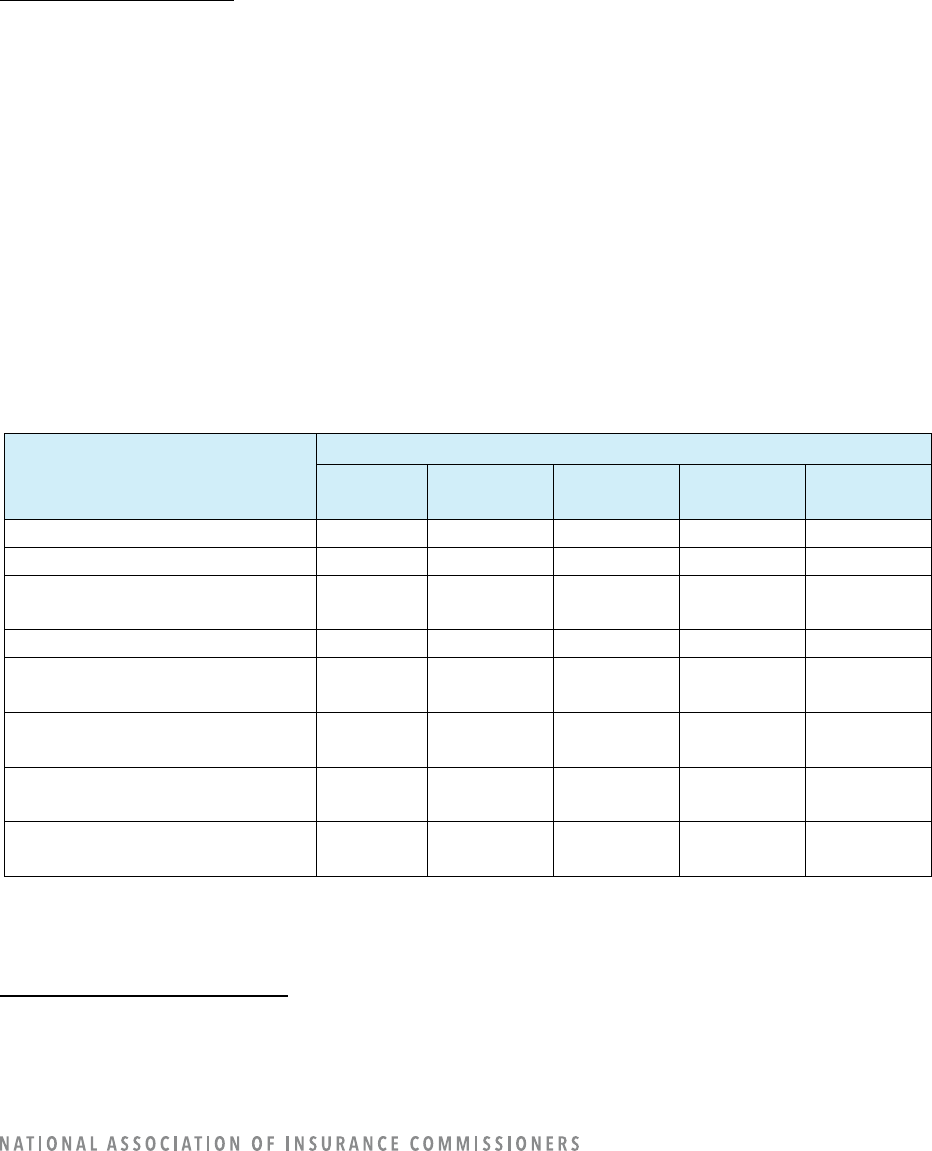
Table 2: Companies’ Reasons for Not Using AI/ML
If not using AI/ML, why?
Options listed in the survey:
Number of
Companies
No compelling business reason
10
Waiting for regulatory guidance
6
Lack of resources and expertise
9
Lack of reliable data and associated security risk
6
Reliance on legacy systems requiring IT (Information
Technology), data, and technology system upgrade before
starting AI/ML initiatives
7
Waiting on the availability of a third-party vendor
product/service
1
Risk not commensurate with current strategy or appetite
4
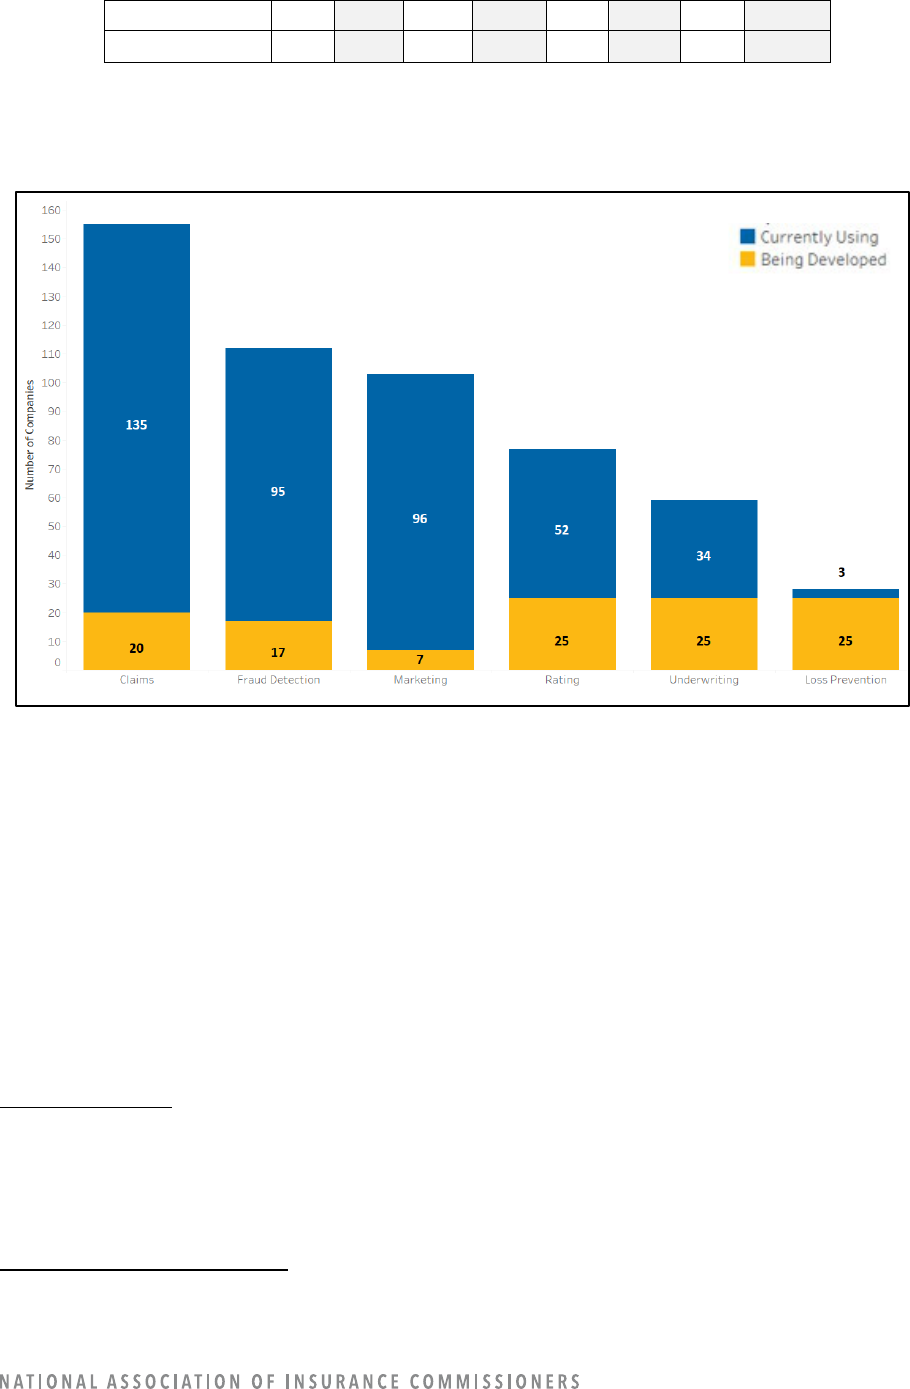
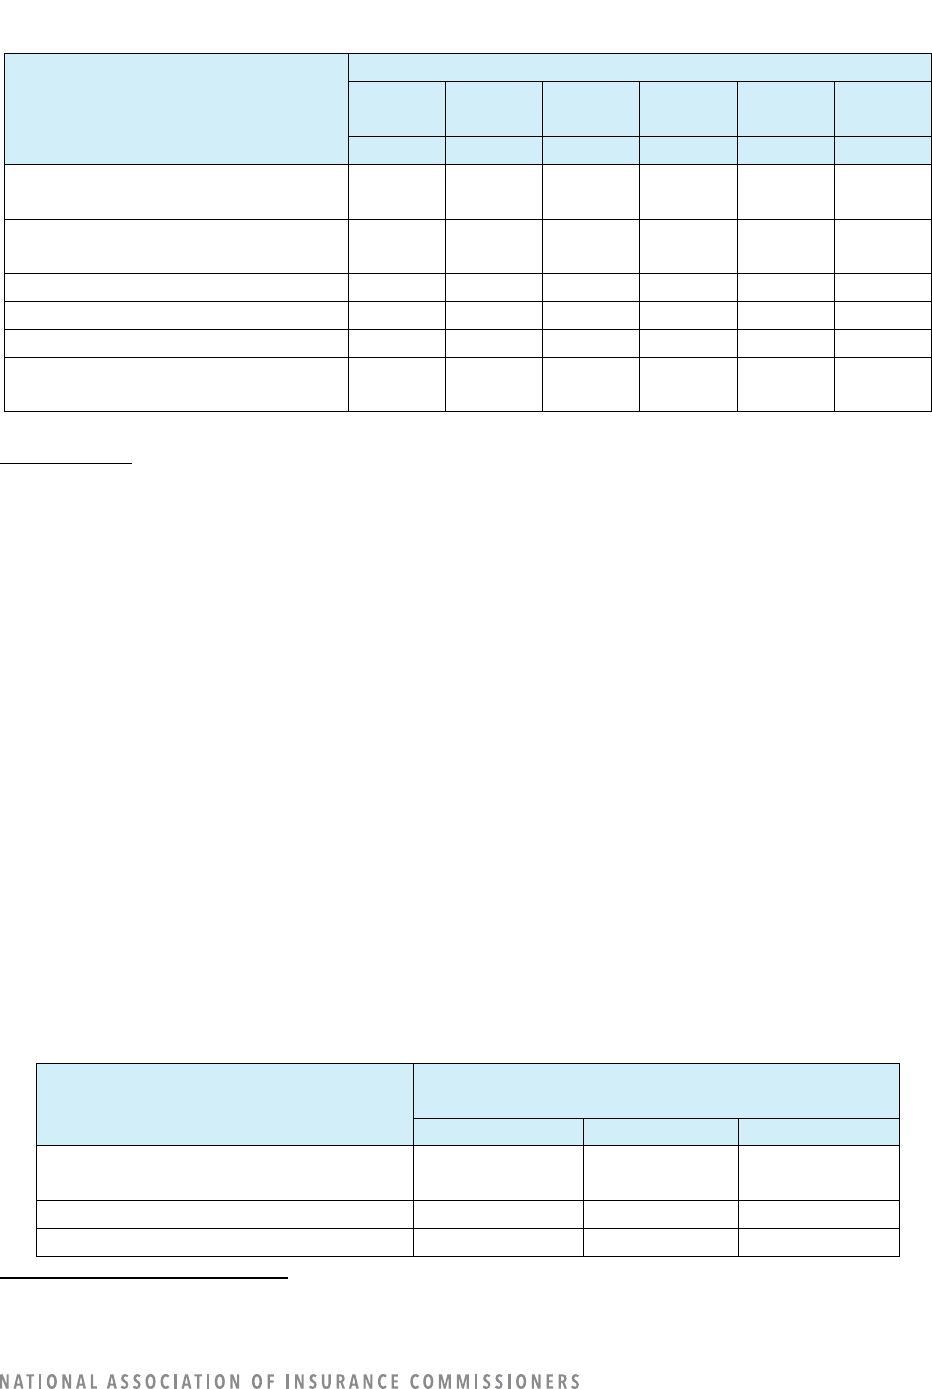
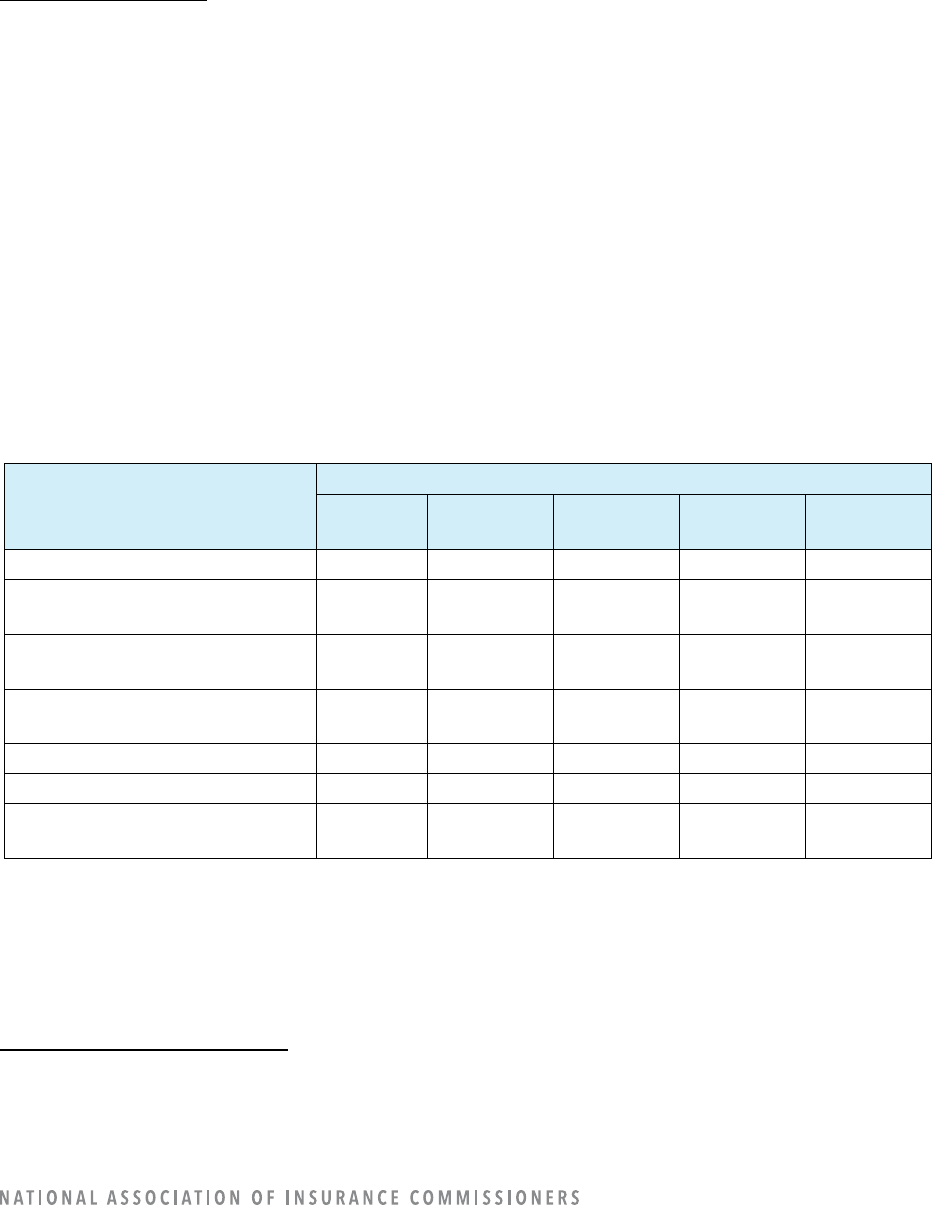
Among company operations areas, companies reported varying levels of AI/ML use, from only 2% in the
loss prevention area to 70% in claims operations. In order from maximum to minimum use, the percentage
of companies using AI/ML for the following operation areas were: claims, 70%; marketing, 50%; fraud
detection, 49%; rating, 27%; underwriting, 18%; and loss prevention 2%. Adding in the companies with
models under construction, the percentages were: claims, 80%; fraud detection, 58%; marketing, 54%;
rating, 40%; underwriting, 31%; and loss prevention, 15%. (Refer to Table 3.)
Intuitively, one might expect to see rating and/or underwriting as the areas with the largest amount of
AI/ML use. The results of this survey are purposely affected by the definition of AI/ML to exclude the
most-often used types of rating and underwriting models to focus on the more advanced types of AI/ML.
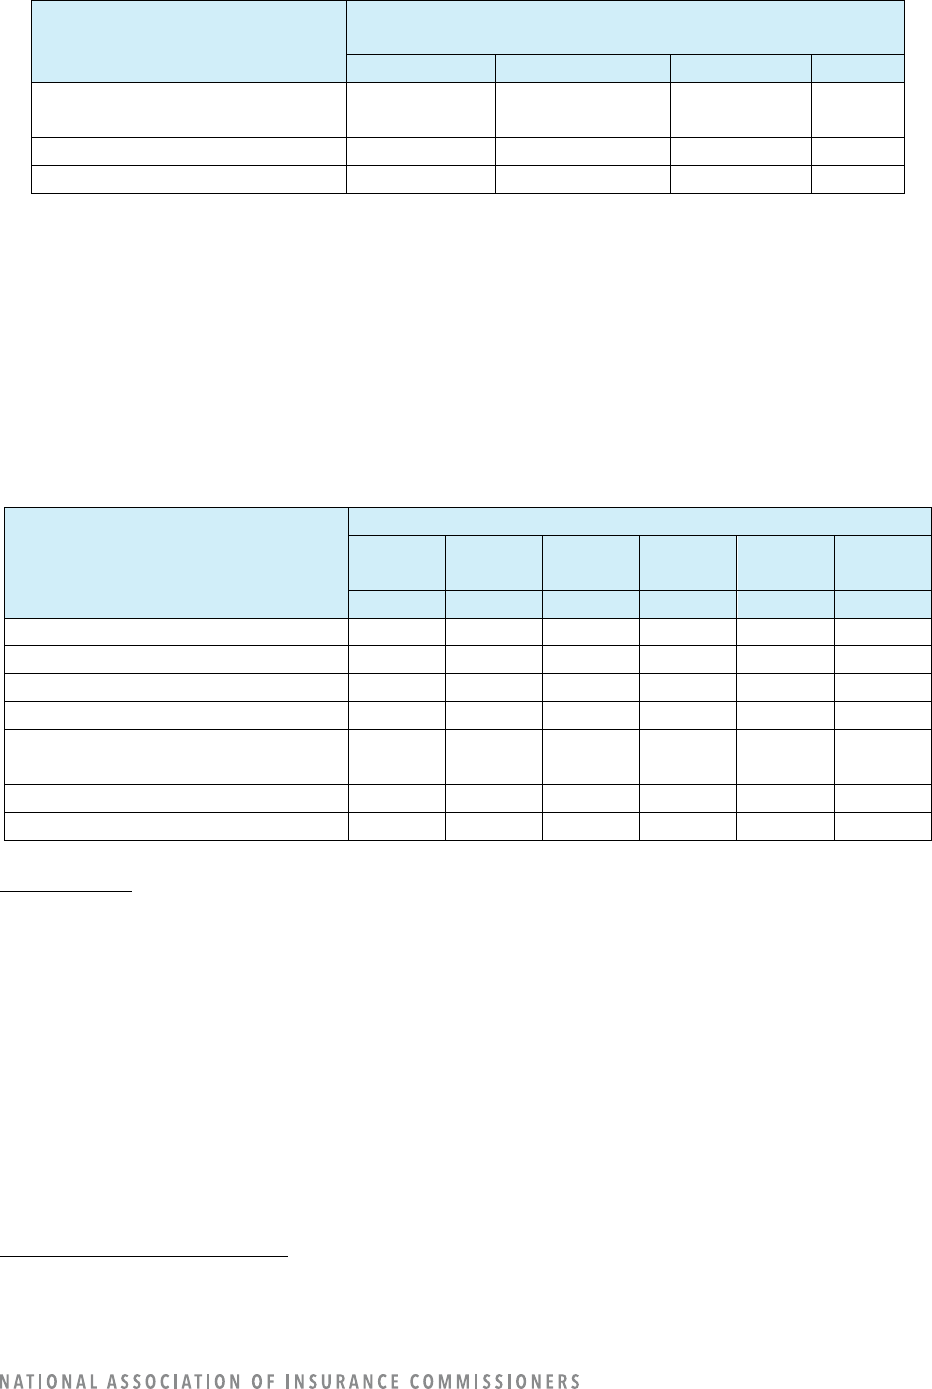
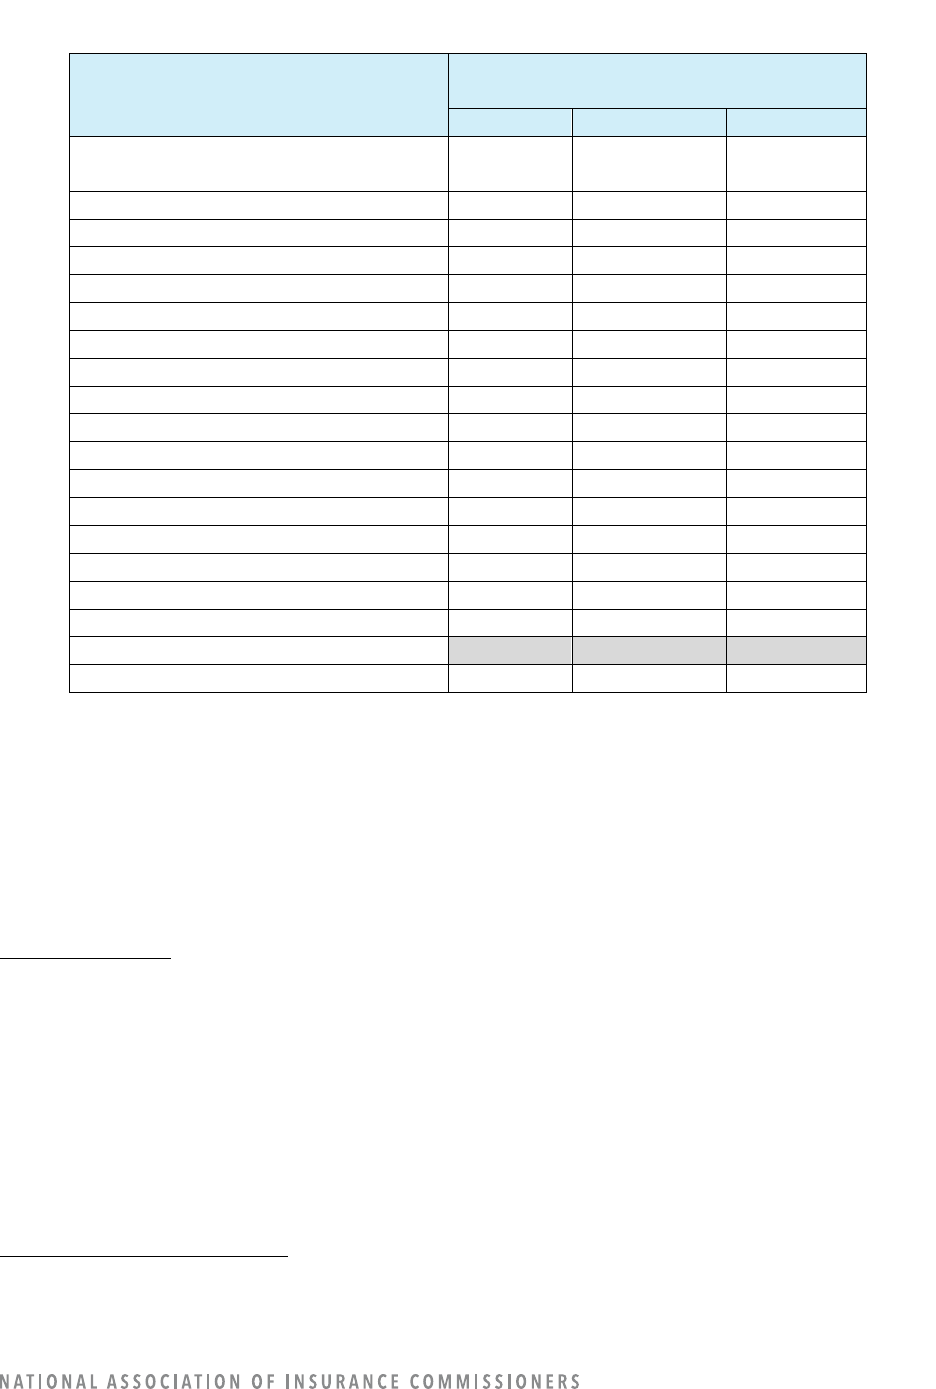
Table 3: Companies with Models in Use or Under Construction by Company Operation Area
Company
Operation
Area
1
Number and Percentage of Companies
In Use
Under
Construction
2
None (N/A) Total
#
%
#
%
#
%
#
%
Rating
52
27%
25
13%
116
60%
193
100%
Underwriting
34
18
25
13
134
69
193
100
Claims
135
70
20
10
38
20
193
100
Fraud Detection
95
49
17
9
81
42
193
100
1
For definitions, refer to Appendix A: Guidance for Questions in Each Operational Area: Rating, Underwriting, Claims, Fraud
Detection, Marketing, Loss Prevention.
2
The “under construction” category had options of number of years until expected implementation, but we question the results
of the categorization because the choices in the survey were ambiguous. For example, there was not a consistent understanding
of whether “< 1 year” meant that the company will be implementing AI/ML in the next year or if the company had been using
AI/ML for less than a year.
10
Marketing
96
50
7
4
90
47
193
100
Loss Prevention
3
2
25
13
165
85
193
100
The same information is shown pictorially in Figure 1.
Figure 1: Number of Companies Currently Using or Developing AI/ML Models
In addition to the company operations areas listed in the survey template, companies provided numerous
“other” AI/ML uses. The following are additional uses of AI/ML: agency models (portal effectiveness and
insights, agency and sales management, cross-selling); customer interactions (chatbot, customer care
operations, call center, customer experience, and customer service); information technology (IT)-related
models (performance monitoring, threat detection/protection); knowledge management; language
processing (speech-to-text, event insights); operational efficiency; social media sentiment analysis;
premium audits; video imaging to predict accidents; and workload forecasting.
COMPANY OPERATION: CLAIMS
3
Out of 193 reporting companies, 135 reported using AI/ML for claims operations, and 20 reported having
models under construction.
Claims Model Uses
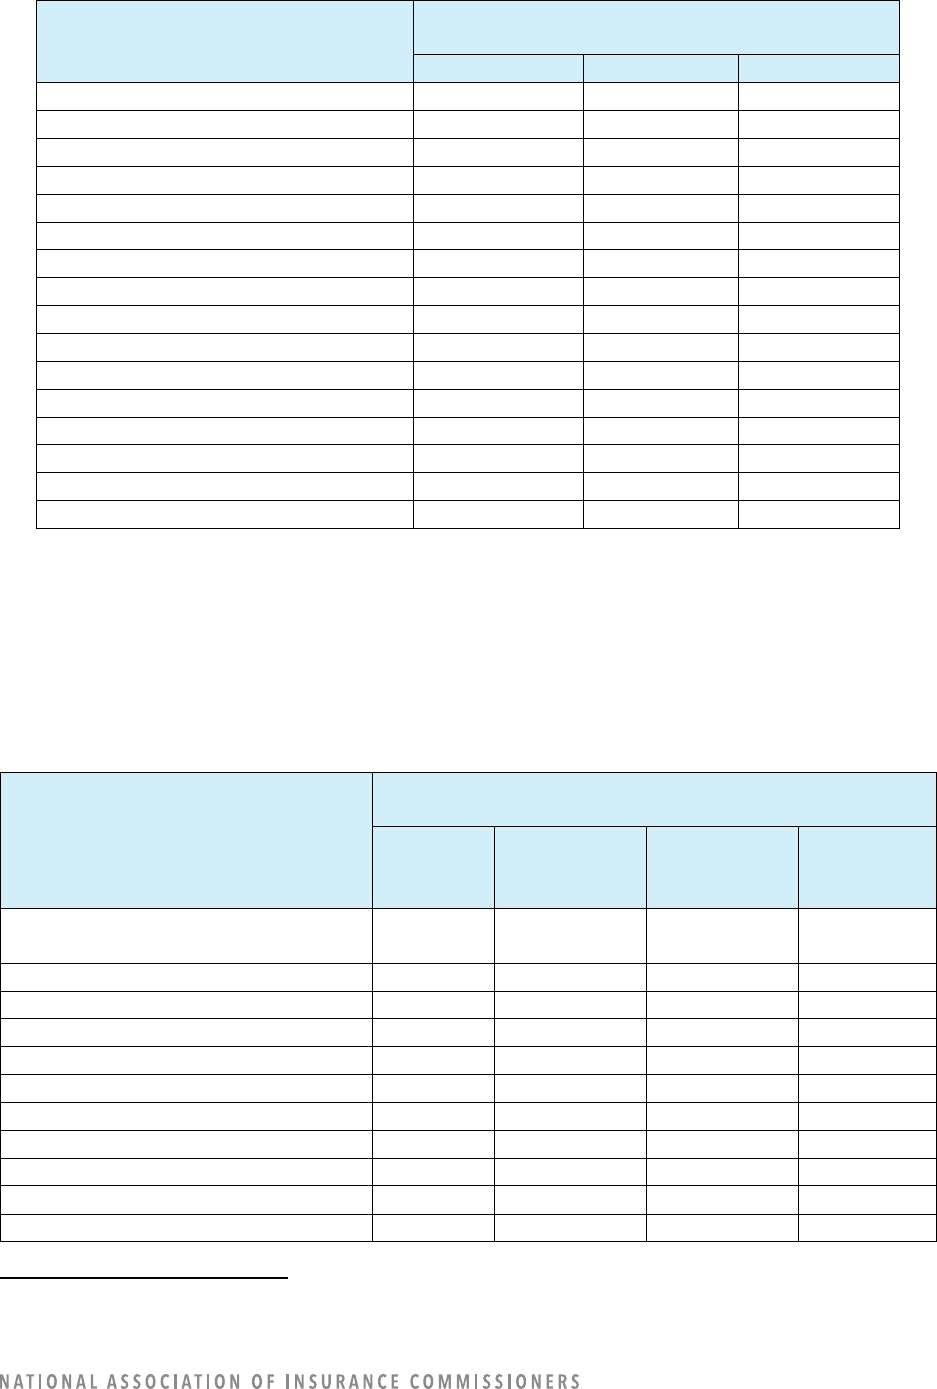
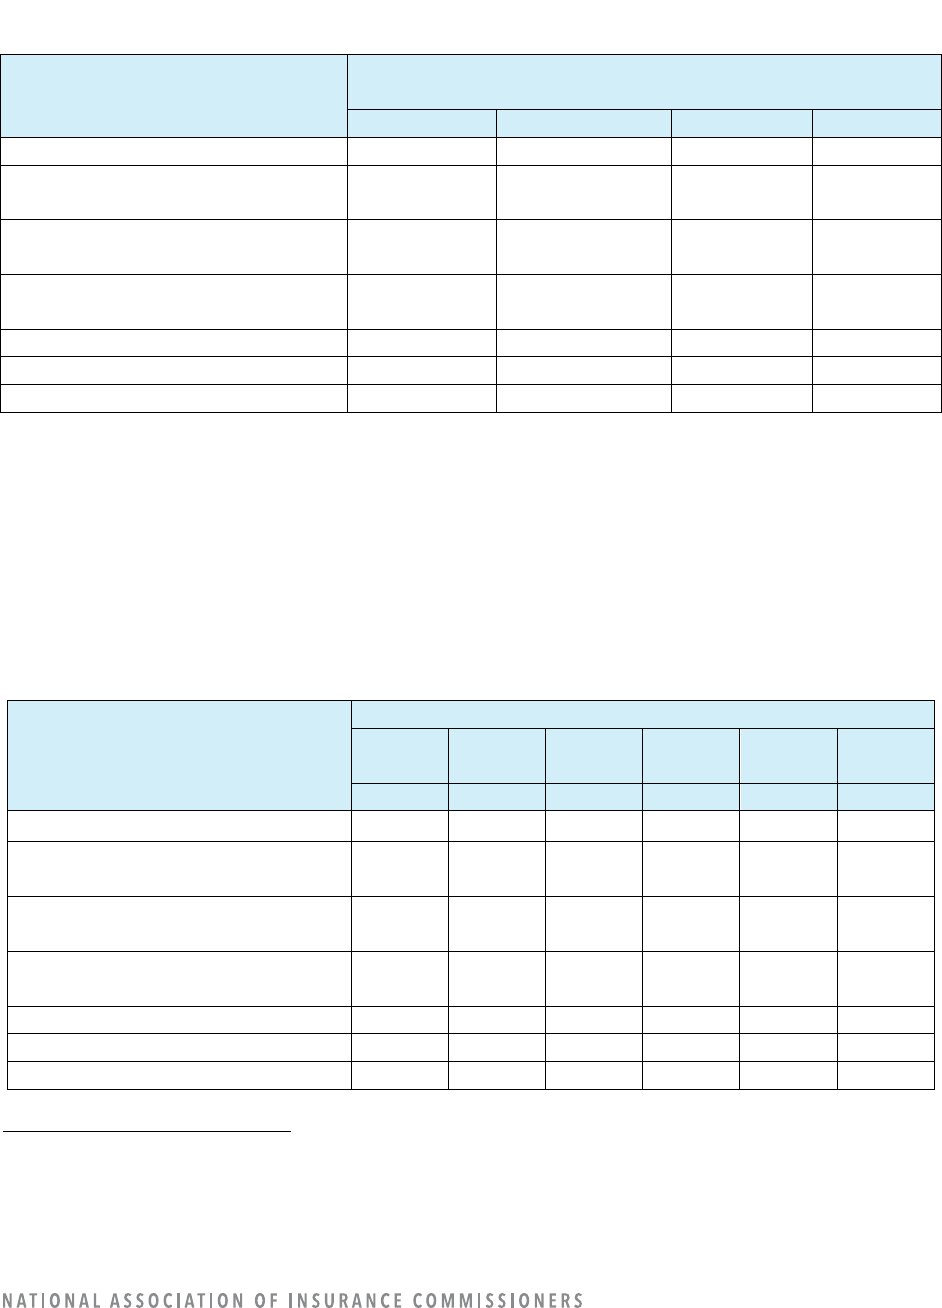
In insurance claims operations, companies reported currently using AI/ML claims models mostly as an
informational resource for adjusters (96 companies). Few companies are using AI/ML claims models for
claims approvals (9) and none are using them for claims denials. Other AI/ML claims models are currently
used to determine claim settlement amounts (50), to make claim assignment decisions (58), to evaluate
3
For definitions, refer to Appendix B: Definitions Specific to Claims.
11
images of loss (55), and for other claim-related functions (66). The uses of claims models identified in
Table 4 were options that could be selected in the survey template. Companies noted some additional
uses of claims models in their write-in comments: subrogation potential, claims triage, speech analysis,
loss recognition, litigation likelihood, selection of claims for a streamlined liability investigation process,
accident detection, listen to voice calls, claim classification, work prioritization, reserving, reserve
management, fast-track processing, volume forecasting, leadership quality reviews, call deflection, early
total loss recognition, uninsured motorist exposure, physical damage assessment, arbitration, “doc bot,”
and supplemental requests on claims. One company mentioned the use of AI/ML to recommend repair
shops.
Once models under construction begin to be used, companies will most often be using AI/ML claims
models for evaluation of images of the loss (114 companies) and other claim-related functions (113).
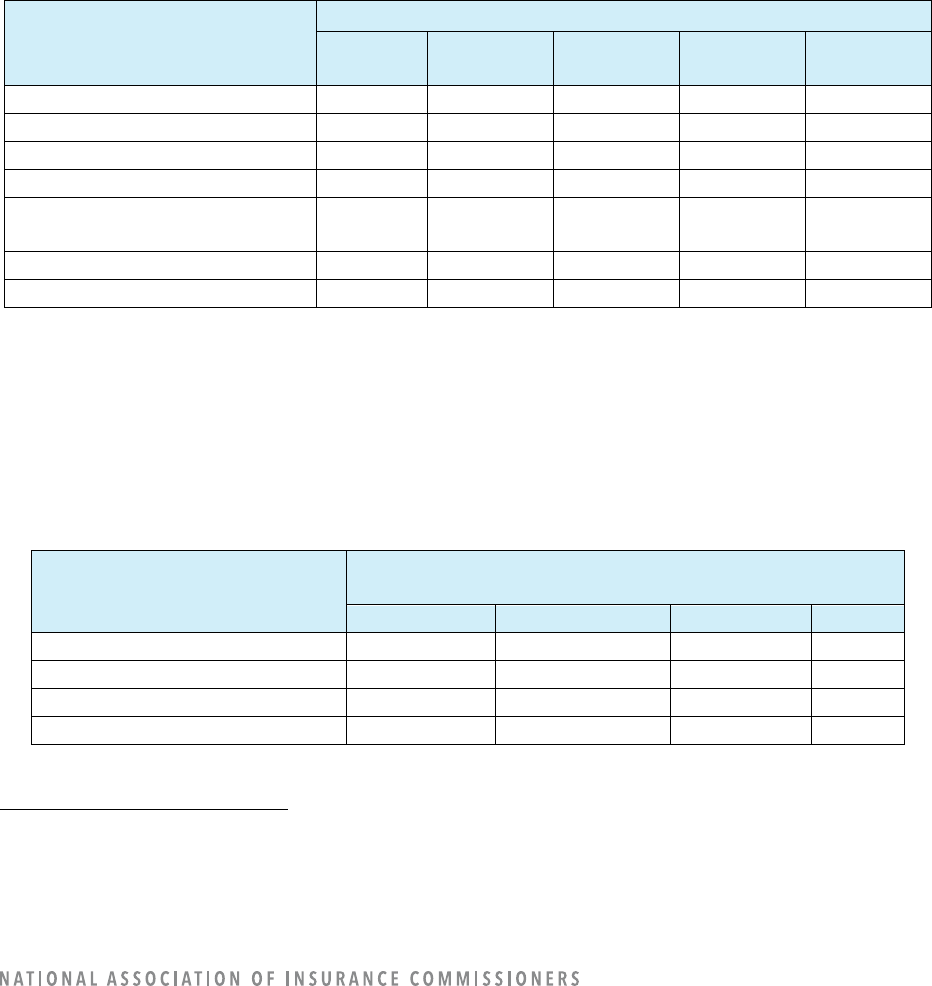
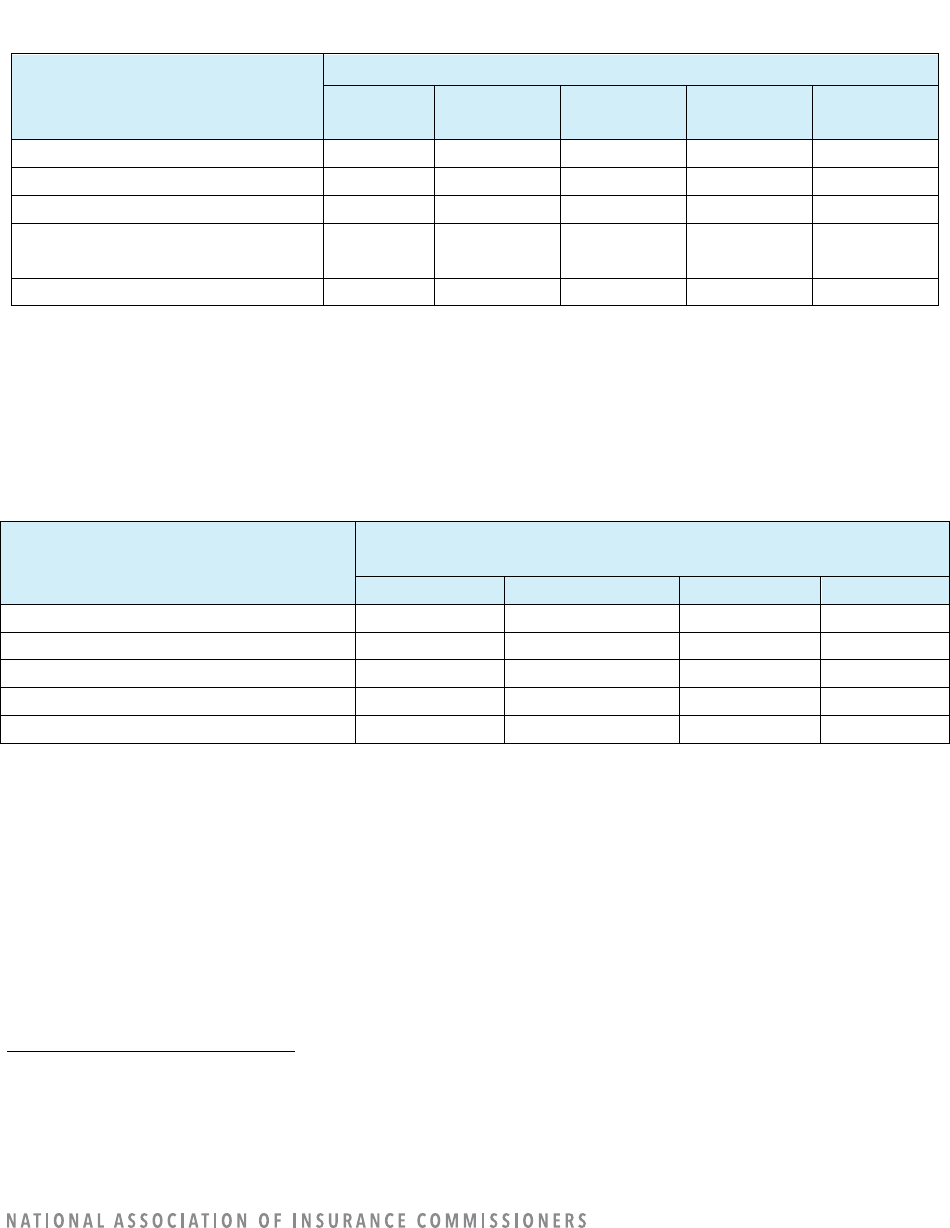
Table 4: Companies’ Use of Claims Models
Claims Model Uses
4
Number of Companies
In Use
Research
Proof of
Concept
Prototype
None
Claim Approval
9
5
0
0
179
Claim Denial
0
0
0
0
193
Determine Settlement Amount
50
6
10
3
124
Claim Assignment Decisions
58
15
11
1
108
Informational Resource for
Adjusters
96
0
3
0
94
Evaluation of Images of the Loss
55
24
27
8
79
Other Claim-Related Functions
66
21
11
15
80
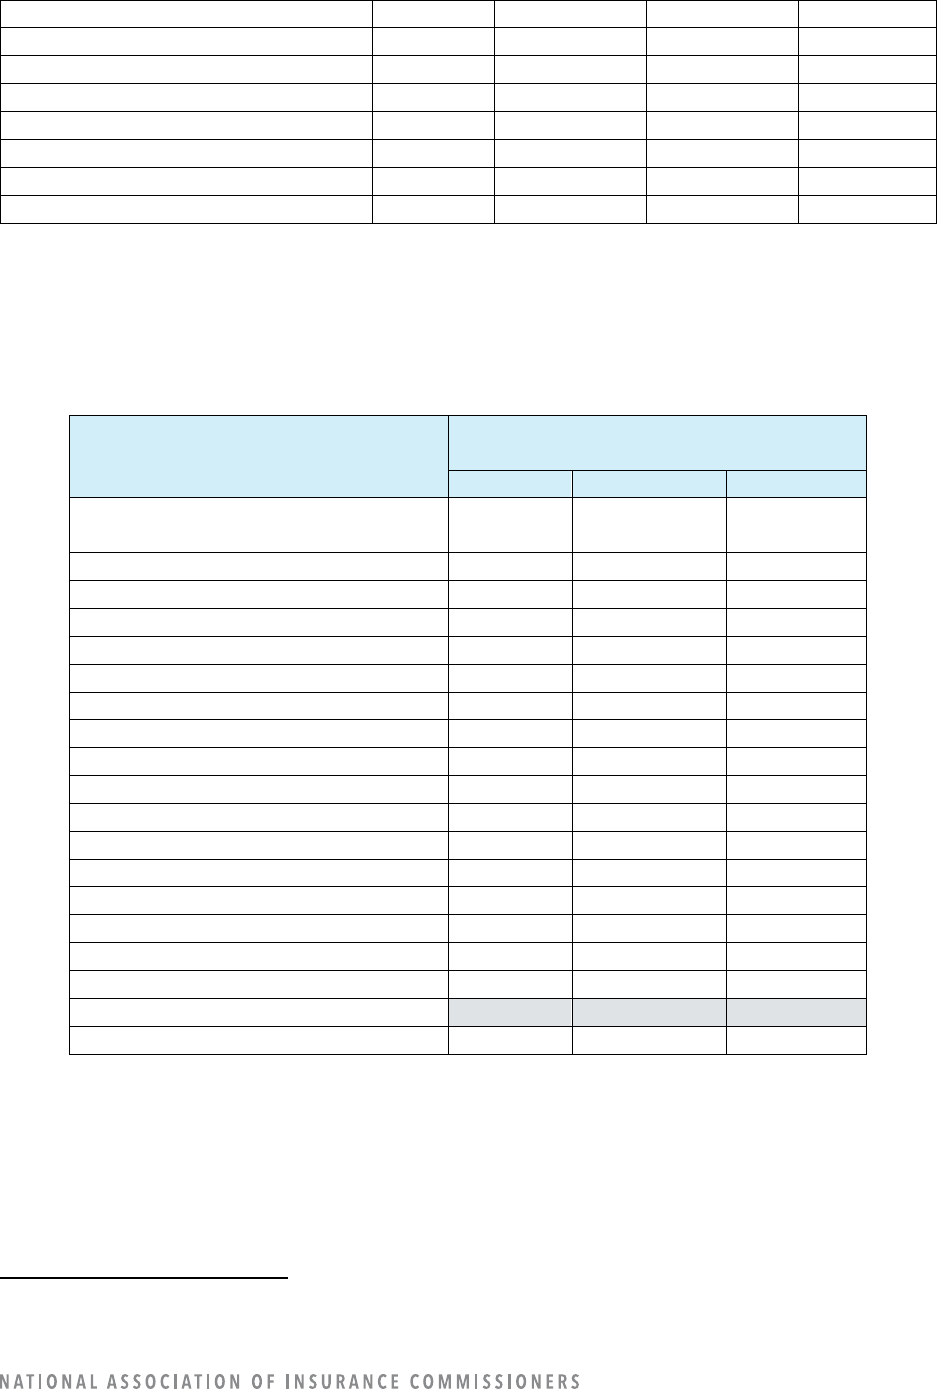
The level of insurance company employee decisions influenced by AI/ML varies by model use.
Determination of settlement amount tends to include augmentation, defined as suggesting an answer
and advising the human who is making the decision. Claim assignment decisions tend to be automated or
at least the models provide augmentation. (Refer to Table 5). Note that Table 5 differs from the previous
tables because the data represents the number of models instead of the number of companies.
Table 5: Level of Decision-Making by Use of Claims Models
Claims Model Uses
5
Number of Models (In Use or Under Construction) by
Level of Decisions Influenced by AI/ML
Automation*
Augmentation*
Support*
Other
Claim Approval
9
6
0
0
Claim Denial
0
0
0
0
Determine Settlement Amount
30
94
11
0
Claim Assignment Decisions
106
81
8
0
4
For definitions, refer to Appendix A: Guidance for Questions in Each Operational Area: Rating, Underwriting, Claims, Fraud
Detection, Marketing, Loss Prevention.
5
For definitions, refer to Appendix A: Guidance for Questions in Each Operational Area: Rating, Underwriting, Claims, Fraud
Detection, Marketing, Loss Prevention.
12
Claims Model Uses
5
Number of Models (In Use or Under Construction) by
Level of Decisions Influenced by AI/ML
Automation*
Augmentation*
Support*
Other
Informational Resource for
Adjusters
6
82
164
0
Evaluation of Images of the Loss
16
201
35
0
Other Claim-Related Functions
34
95
92
2
*“Automation” was defined as no human intervention on execution. “Augmentation” was defined as a model that
suggests an answer and advises the human making a decision. “Support” was defined as a model that provides
information but does not suggest a decision or action.
Models being used by insurance companies are developed in-house (with or without third-party
assistance) or purchased from a third party. Models for claim approval, claim assignment decisions,
adjusters’ informational resource, and other claim-related functions tend to be developed in-house.
Models used to determine settlement amounts and evaluate images of the loss tend to be developed by
third parties. (Refer to Table 6.)
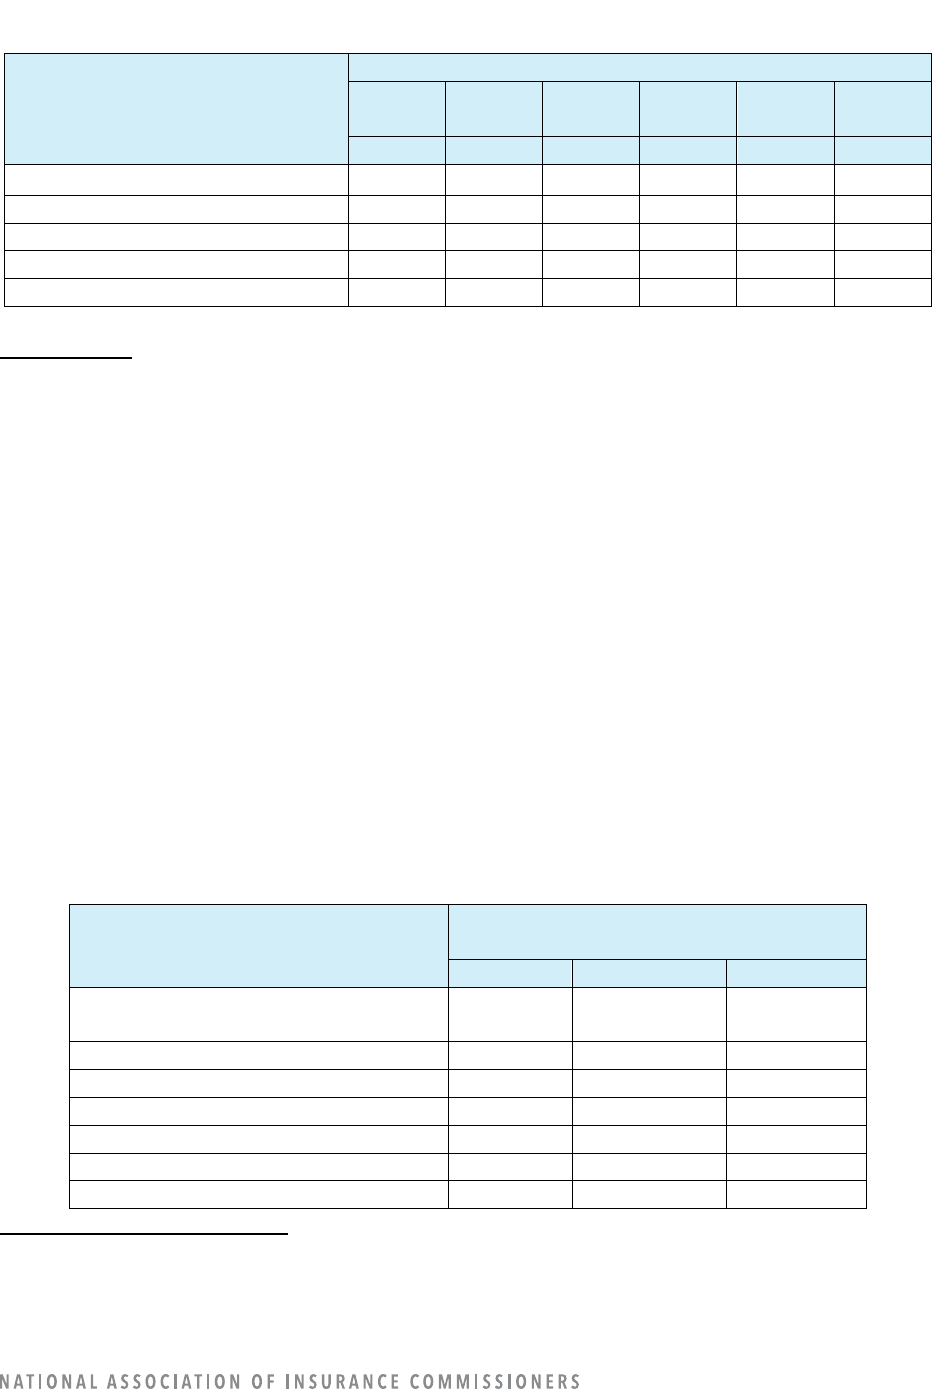
Table 6: Claims Model Sources by Model Use
Claims Model Uses
6
Model Source
In-
House
In-
House
Third-
Party
Third-
Party
Total Total
#
%
#
%
#
%
Claim Approval
11
73%
4
27%
15
100%
Claim Denial
0
0
0
0
0
100
Determine Settlement Amount
27
20
108
80
135
100
Claim Assignment Decisions
155
79
40
21
195
100
Informational Resource for
Adjusters
222
88
30
12
252
100
Evaluation of Images of the Loss
70
28
182
72
252
100
Other Claim Related Functions
172
77
51
23
223
100
Data Elements
It is well known that insurers use big data for many purposes and models. Given this survey is focused on
the use of the “more advanced” AI/ML, the data element information here is similarly focused on the use
of data elements only when used in “more advanced” AI/ML models.
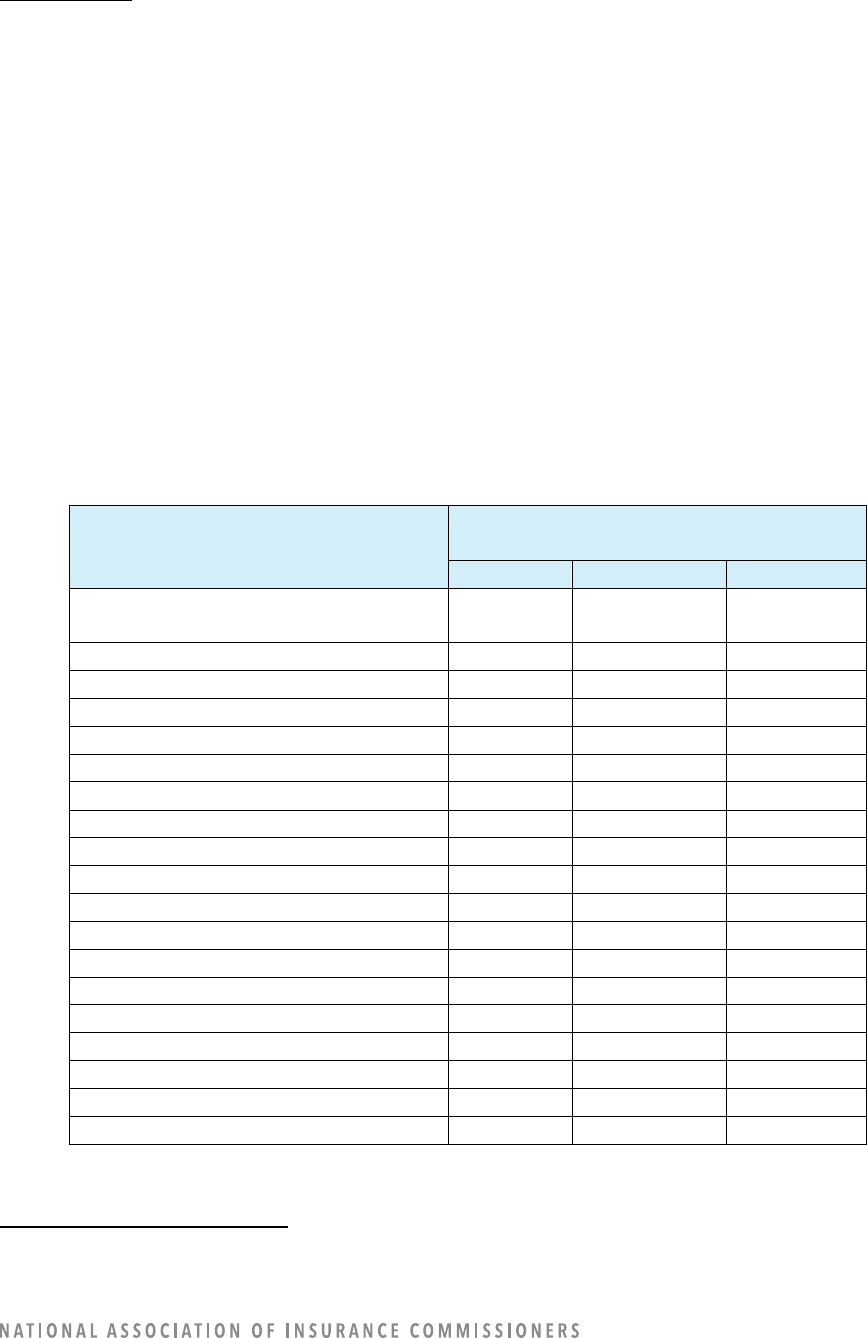
For claims, the following five data elements were the most frequently reported as being used for AI/ML:
• Vehicle-specific data (123 companies)
• Loss experience (74)
• Medical (63)
• Geocoding (22)
• Telematics (21)
6
For definitions, refer to Appendix A: Guidance for Questions in Each Operational Area: Rating, Underwriting, Claims, Fraud
Detection, Marketing, Loss Prevention.
13
There are at least some companies using a consumer or other type of “score” (16), driving behavior (10),
criminal convictions (9), voice analysis (8), online media (7), education (2), and personal financial
information (2). Companies also reported using “other” nontraditional data elements (32). (Refer to Table
7.)
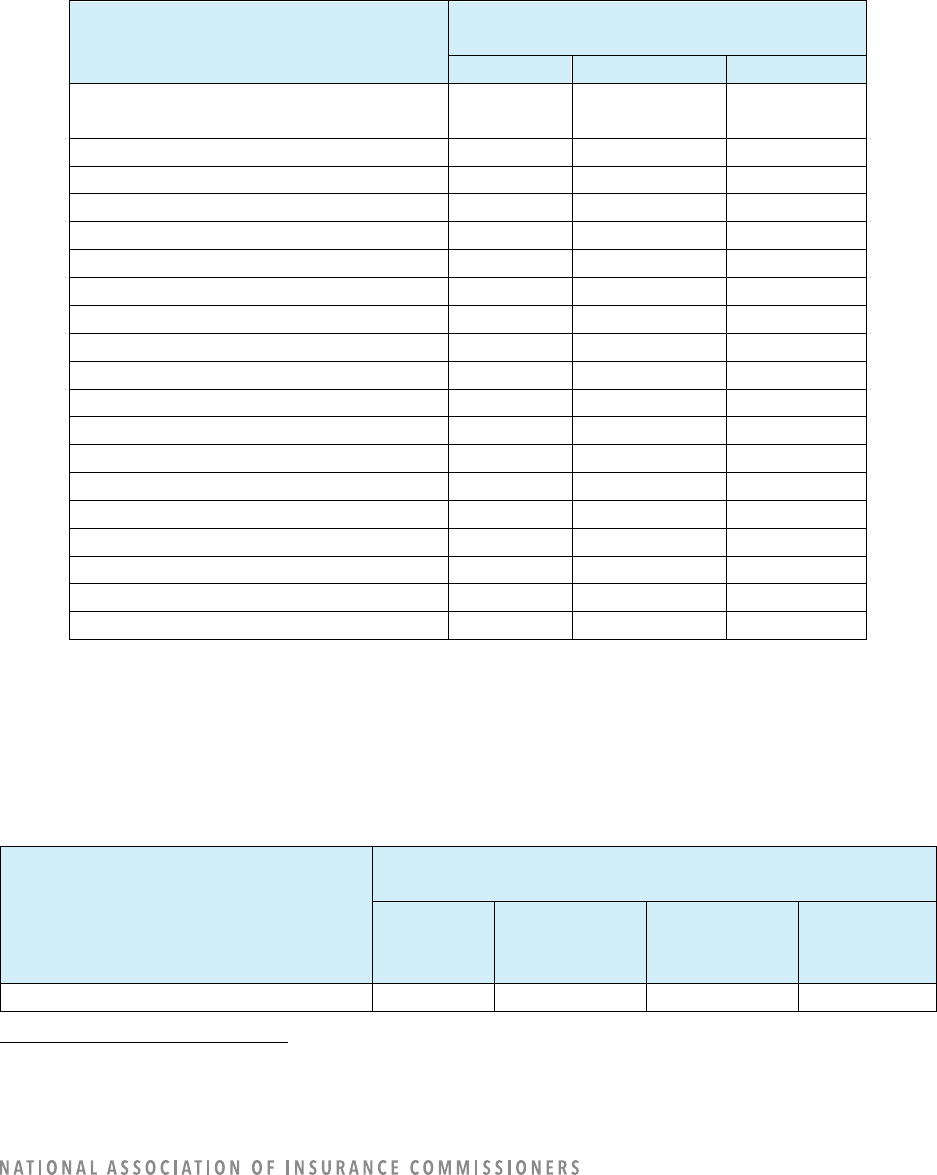
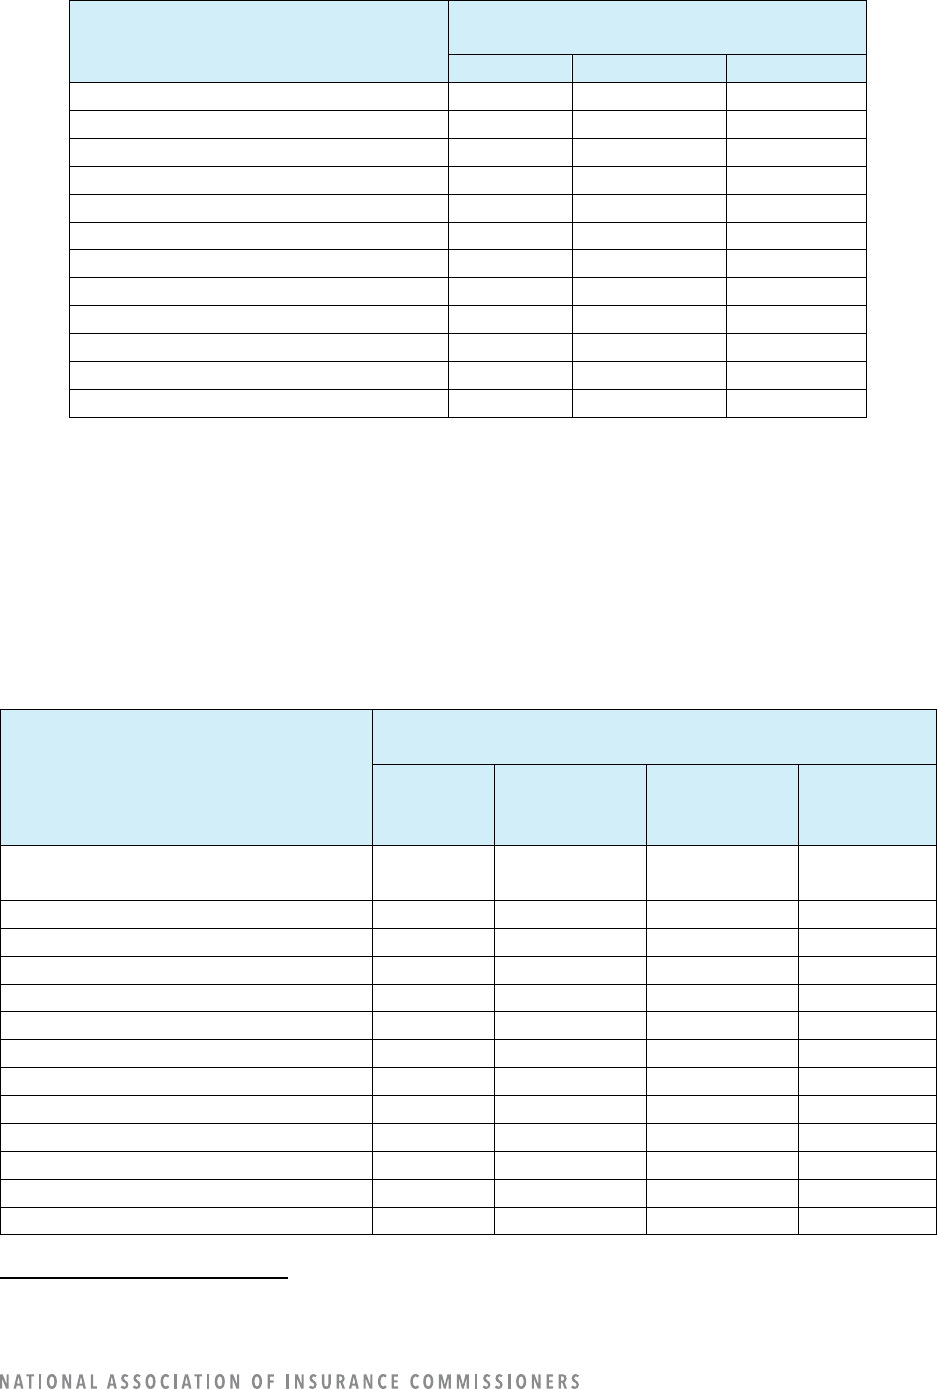
Table 7: Companies’ Use of Claims Data Elements
Claims Data Elements
7
Number of Companies Using/Not Using the
Data Element in a Claims AI/ML Model*
Yes
No
Blank
Criminal Conviction
(Excluding Auto-Related Convictions)
9
153
31
Demographic
40
122
31
Driving Behavior
10
152
31
Education
2
160
31
Vehicle-Specific Data
123
39
31
Facial Detection/Recognition/Analysis
0
162
31
Geocoding
22
140
31
Natural Catastrophe
0
162
31
Job Stability
0
162
31
Income
0
162
31
Occupation
0
162
31
Personal Financial Information
2
160
31
Loss Experience
74
88
31
Medical
63
99
31
Online Media
7
155
31
Telematics
21
141
31
Voice Analysis
8
153
32
Consumer or Other Type of “Score”
16
147
30
Other Nontraditional Data Elements
32
130
31
*The question is not whether the data element is used, but only whether the data element is used in an
AI/ML model.
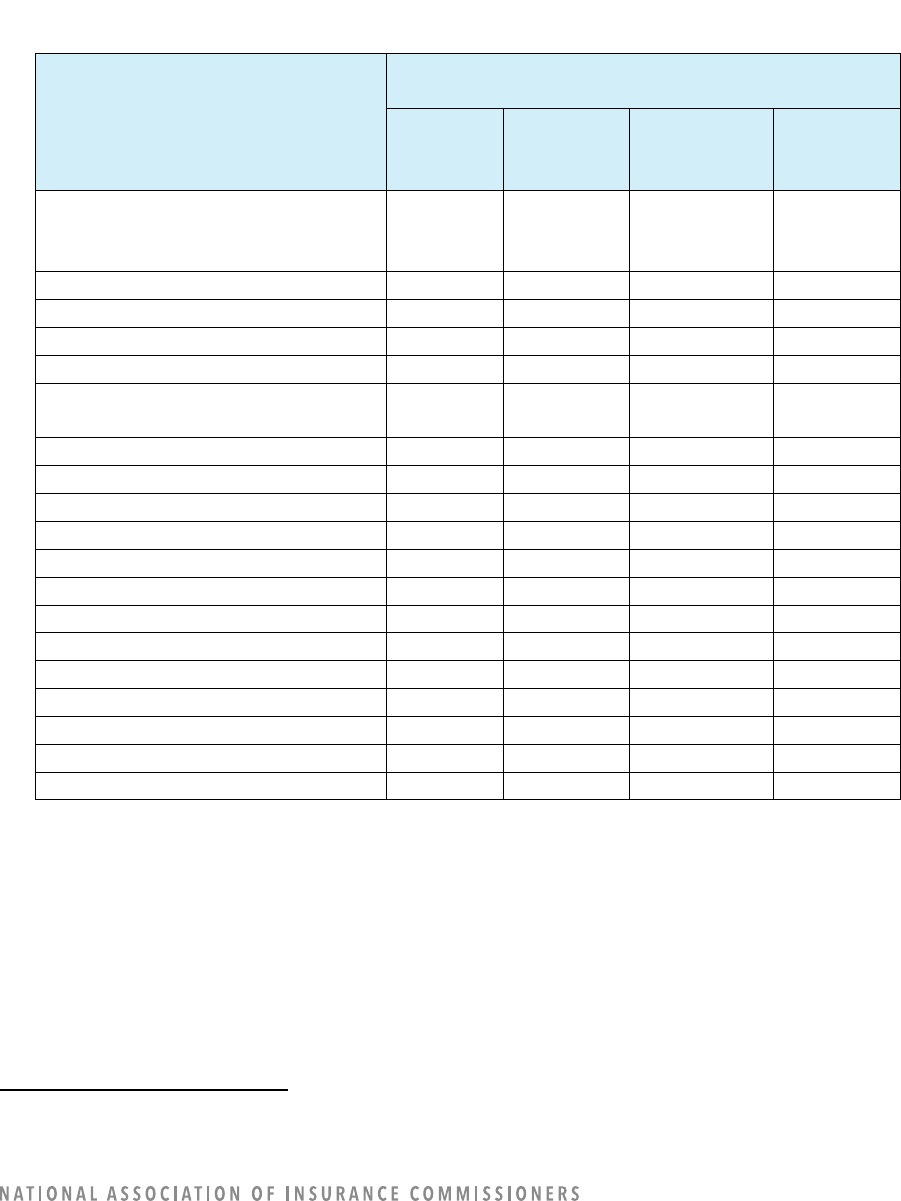
The data elements used in claims models tend to be internal data sources or a mix of internal and
external sources. (Refer to Table 8.)
Table 8: Claims Model Sources (Internal vs. Third Party) by Data Elements
Claims Data Elements
8
# of Companies Using the Data Element
in a Claims AI/ML model*
Internal
Data
Source
External
Data
Source
Both Internal
and External
Data Sources
Blank
Criminal Conviction
0
9
0
184
7
For definitions, refer to Appendix H: Data Use Table Definitions.
8
For definitions, refer to Appendix H: Data Use Table Definitions.
14
Claims Data Elements
8
# of Companies Using the Data Element
in a Claims AI/ML model*
Internal
Data
Source
External
Data
Source
Both Internal
and External
Data Sources
Blank
(Excluding auto-related convictions)
Demographic
20
2
18
153
Driving Behavior
7
0
3
183
Education
0
2
0
191
Vehicle-Specific Data
51
21
51
70
Facial Detection/Recognition/Analysis
0
0
0
193
Geocoding
13
7
2
171
Natural Catastrophe
0
0
0
193
Job Stability
0
0
0
193
Income
0
0
0
193
Occupation
0
0
0
193
Personal Financial Information
0
2
0
191
Loss Experience
50
16
8
119
Medical
45
4
14
130
Online Media
0
7
0
186
Telematics
1
7
13
172
Voice Analysis
6
0
2
185
Consumer or Other Type of “Score”
7
2
7
177
Other Non-Traditional Data Elements
31
1
0
161
Very few companies reported using a consumer or other type of “score” as an input for claims models.
(Refer to Table 9.)
Table 9: Companies’ Use of Consumer or Other Type of “Score” as an Input for Claims Data Elements
Claims Data Elements
9
Number of Companies Using a Consumer or
Other Type of “Score” as an Input
Yes
No
Blank
Criminal Conviction
(Excluding Auto-Related Convictions)
0
61
132
Demographic
0
69
124
Driving Behavior
0
58
135
Education
0
58
135
Vehicle-Specific Data
3
110
80
Facial Detection/Recognition/Analysis
0
58
135
Geocoding
1
59
133
Natural Catastrophe
0
58
135
Job Stability
0
58
135
Income
0
58
135
Occupation
0
58
135
9
For definitions, refer to Appendix H: Data Use Table Definitions.
15
Claims Data Elements
9
Number of Companies Using a Consumer or
Other Type of “Score” as an Input
Yes
No
Blank
Personal Financial Information
0
58
135
Loss Experience
0
73
120
Medical
0
68
125
Online Media
0
58
135
Telematics
0
65
128
Voice Analysis
0
58
135
Consumer or Other Type of “Score”
Other Nontraditional Data Elements
0
83
110
Refer to the “Customer Data Correction,” “Governance,” and “Third-Party” sections of this report for
additional data analysis regarding company operations areas.
COMPANY OPERATION: FRAUD DETECTION
10
Out of 193 reporting companies, 95 companies reported using AI/ML for fraud-detection operations, and
17 reported having models under construction.
Fraud-Detection Model Uses
In insurance fraud detection, companies reported currently using AI/ML models mostly as a referral of
claims for further investigation (83 companies). Other AI/ML fraud-detection models are currently used
in the following areas: detect medical producer fraud (27), detect third-party liability (17), fast-tracking of
likely non-fraudulent claims (10), detect first-party liability (10), and “other” fraud detection-related
functions (four). The uses of fraud-detection models identified in Table 10 were options that could be
selected in the survey template. Companies noted some additional uses of fraud-detection models in their
write-in comments: fraudulent quote detection, organized crime rings identification, social network
analysis, facial recognition, behavior models, detect prefill information harvesters, device risk, and claims
watch list.
Some models are under construction for fraud detection, but there appears to be no significant
development planned in the near future.
Table 10: Companies’ Use of Fraud-Detection Models
Fraud-Detection Model Uses
11
Number of Companies
In Use
Research
Proof of
Concept
Prototype
None (N/A)
Fast-Tracking of Likely Non-
Fraudulent Claims
10
15
3
1
164
Referral of Claims for Further
Investigation
83
3
6
3
98
10
For definitions, refer to Appendix C: Definitions Specific to Fraud Detection.
11
For definitions, refer to Appendix A: Guidance for Questions in Each Operational Area: Rating, Underwriting, Claims, Fraud
Detection, Marketing, Loss Prevention.
16
Fraud-Detection Model Uses
11
Number of Companies
In Use
Research
Proof of
Concept
Prototype
None (N/A)
Detect Medical Producer Fraud
27
3
2
9
152
Detect First-Party Liability
10
2
2
1
178
Detect Third-Party Liability
17
2
2
1
171
Other Fraud Detection-Related
Functions
4
2
12
4
171
The level of decisions influenced by AI/ML varies by model use. Most fraud detection model uses provide
support. For referral of claims for further investigation, there is an even split between augmentation and
support. (Refer to Table 11. Note that Table 11 differs from the previous tables because the data
represents the number of models instead of the number of companies.)
Table 11: Level of Decision-Making by Use of Fraud-Detection Models
Fraud-Detection Model Uses
12
Number of Models (In Use or Under Construction) by
Level of Decisions Influenced by AI/ML
Automation*
Augmentation*
Support*
Other
Fast-Tracking of Likely Non-
Fraudulent Claims
1
5
23
1
Referral of Claims for Further
Investigation
0
89
93
2
Detect Medical Producer Fraud
0
17
44
0
Detect First-Party Liability
1
4
13
0
Detect Third-Party Liability
1
11
13
0
Other Fraud Detection-Related
Functions
0
8
26
0
*“Automation” was defined as no human intervention on execution. “Augmentation” was defined as a model that suggests an
answer and advises the human making a decision. “Support” was defined as a model that provides information but does not
suggest a decision or action.
Models to detect first-party and third-party liability tend to be developed by third parties. The model use
of “Other Fraud Detection-Related Functions” tended to be developed by third parties. All other uses of
fraud detection models result from a mixture of in-house and third-party models. (Refer to Table 12.)
12
For definitions, refer to Appendix A: Guidance for Questions in Each Operational Area: Rating, Underwriting, Claims, Fraud
Detection, Marketing, Loss Prevention.
17
Table 12: Fraud-Detection Model Sources by Model Use
Fraud-Detection Model Uses
Model Source
In-
House
In-
House
Third-
Party
Third-
Party
Total Total
#
%
#
%
#
%
Fast-Tracking of Likely Non-
Fraudulent Claims
15
50%
15
50%
30
100%
Referral of Claims for Further
Investigation
120
65
64
34
184
100
Detect Medical Producer Fraud
39
64
22
36
61
100
Detect First-Party Liability
3
17
15
83
18
100
Detect Third-Party Liability
10
40
15
60
25
100
Other Fraud Detection-Related
Functions
9
26
25
74
34
100
Data Elements
The survey was limited to the use of the “more advanced” AI/ML. Therefore, the data element information
here does not represent the industry’s entire use of big data (which would require adding in the data
element information from excluded models (e.g., regression-type models, etc.).
For fraud detection, the following five data elements were the most frequently reported as being used for
AI/ML:
• Loss experience (80 companies)
• Vehicle-specific data (68)
• Medical (67)
• Criminal conviction (43)
• Online media (29)
There are at least some companies using demographic (28 companies), geocoding (21), driving behavior
(6), personal financial information (3), consumer or other type of “score” (3), occupation (1), and
telematics (1) for fraud-detection purposes. Companies also reported using “other” nontraditional data
elements (12). Some of the other uses were: identification of fraudulent quotes and organized crime rings,
detection of prefill information, device risk, claims watch list, social network analysis, facial recognition,
and behavior models. (Refer to Table 13.)
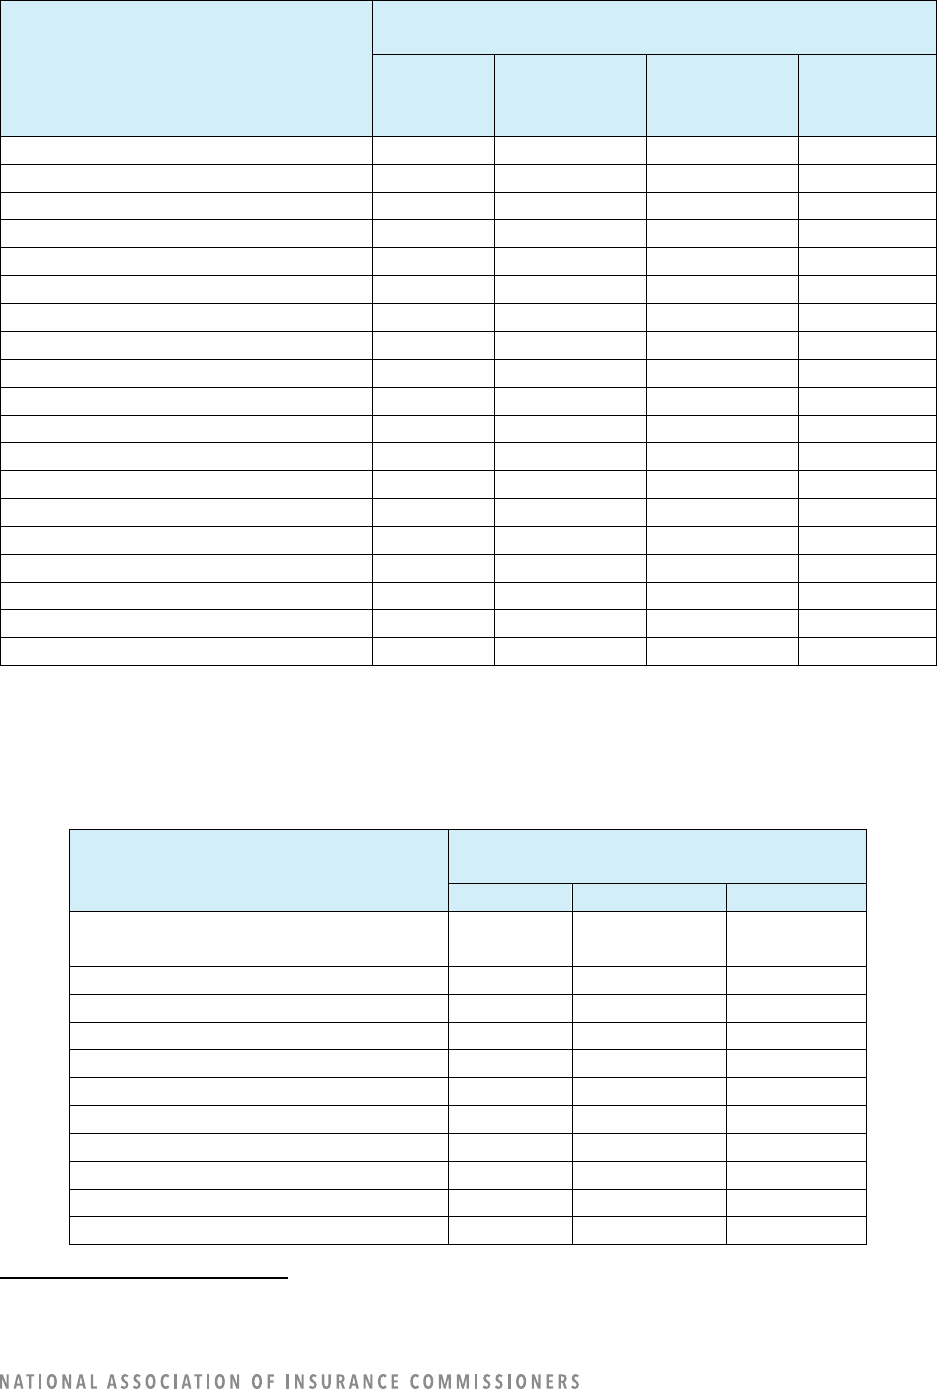
Table 13: Companies’ Use of Fraud-Detection Data Elements
Fraud-Detection Data Elements
13
Number of Companies Using/Not Using the Data
Element in a Fraud-Detection AI/ML Model*
Yes
No
Blank
Criminal Conviction
(Excluding Auto-Related Convictions)
43
79
71
Demographic
28
94
71
Driving Behavior
6
116
71
13
For definitions, refer to Appendix H: Data Use Table Definitions.
18
Fraud-Detection Data Elements
13
Number of Companies Using/Not Using the Data
Element in a Fraud-Detection AI/ML Model*
Yes
No
Blank
Education
0
122
71
Vehicle-Specific Data
68
54
71
Facial Detection/Recognition/Analysis
0
122
71
Geocoding
21
101
71
Natural Catastrophe
0
122
71
Job Stability
0
120
73
Income
0
122
71
Occupation
1
121
71
Personal Financial Information
3
119
71
Loss Experience
80
42
71
Medical
67
55
71
Online Media
29
93
71
Telematics
1
121
71
Voice Analysis
0
122
71
Consumer or Other Type of “Score”
3
119
71
Other Nontraditional Data Elements
12
110
71
*The question is not whether the data element is used, but only whether the data element is used in an AI/ML model.
There are differences in data sources for the data elements. The data elements used in fraud-detection
models are most often from external data sources for criminal conviction, geocoding, and online media.
Other fraud-detection models tend to use internal data sources or a mix of internal and external sources.
(Refer to Table 14.)
Table 14: Fraud-Detection Model Sources (Internal vs. Third Party) by Data Elements
Fraud-Detection Data Elements
14
Number of Companies Using the Data Element
in a Fraud-Detection AI/ML model*
Internal
Data
Source
External
Data
Source
Both Internal
and External
Data Sources
Blank
Criminal Conviction
(Excluding Auto-Related Convictions)
0
36
7
150
Demographic
16
2
10
165
Driving Behavior
3
0
3
187
Education
0
0
0
193
Vehicle-Specific Data
35
2
31
125
Facial Detection/Recognition/Analysis
0
0
0
193
Geocoding
3
18
0
172
Natural Catastrophe
0
0
0
193
Job Stability
0
0
0
193
Income
0
0
0
193
Occupation
1
0
0
192
14
For definitions, refer to Appendix H: Data Use Table Definitions.
19
Personal Financial Information
0
3
0
190
Loss Experience
39
0
41
113
Medical
45
4
18
126
Online Media
0
18
11
164
Telematics
1
0
0
192
Voice Analysis
0
0
0
193
Consumer or Other Type of “Score”
1
2
0
190
Other Nontraditional Data Elements
12
0
0
181
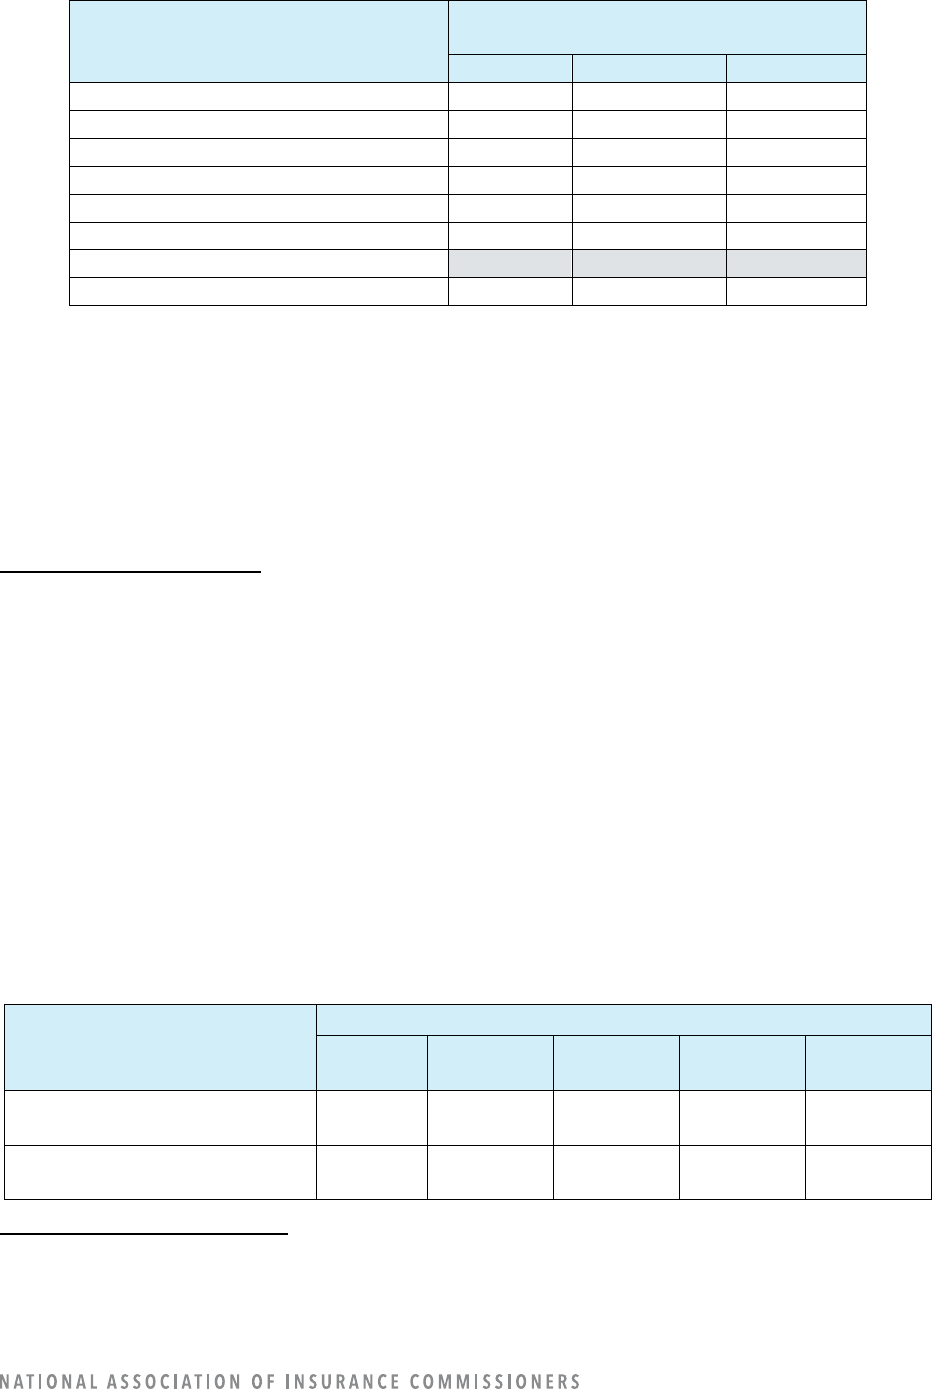
Few companies reported using a consumer or other type of “score” as an input for fraud-detection
models. (Refer to Table 15.)
Table 15: Companies’ Use of Consumer or Other Type of “Score” as an Input for Fraud-Detection Data
Elements
Fraud-Detection Data Elements
15
Number of Companies Using a Consumer or
Other Type of “Score” as an Input
Yes
No
Blank
Criminal Conviction
(Excluding Auto-Related Convictions)
0
64
129
Demographic
0
65
128
Driving Behavior
0
57
136
Education
0
57
136
Vehicle-Specific Data
1
75
117
Facial Detection/Recognition/Analysis
0
57
136
Geocoding
1
58
135
Natural Catastrophe
0
57
136
Job Stability
0
57
136
Income
0
57
136
Occupation
0
57
136
Personal Financial Information
0
57
136
Loss Experience
0
76
117
Medical
0
66
127
Online Media
0
57
136
Telematics
0
57
136
Voice Analysis
0
57
136
Consumer or Other Type of “Score”
Other Nontraditional Data Elements
5
57
131
Refer to the “Customer Data Correction, “Governance,” and “Third-Party” sections of this report for
additional data analysis regarding company operations areas.
15
For definitions, refer to Appendix H: Data Use Table Definitions.
20
COMPANY OPERATION: MARKETING
16
Out of 193 reporting companies, 96 companies reported using AI/ML for fraud-detection operations, and
seven (7) reported having models under construction. So, approximately half of the companies are using
AI/ML for marketing.
Marketing Model Uses
Companies are using many marketing models for multiple uses. Companies use marketing models for
targeted online advertising (56 companies), identification of recipients of mail and phone advertising (42),
provision of offers to existing customers (42), and direct online sales (41). Only 19 companies are currently
using models for identification of potential customer groups, and only seven (7) companies are currently
using AI/ML for demand modeling. Companies are also using marketing models for other marketing-
related functions (46).
The uses of marketing models identified in Table 16 were options that could be selected in the survey
template. Companies noted some additional uses of marketing models in their write-in comments:
customer service, customer-related metrics, customer interactions using natural language processing
(NLP), mixed media modeling, marketing content variation, alternative quote recommendation, creative
optimization, budget and channel spend allocation, customer retention and acquisition (including lifetime
value), referrals, agency rank, and click analysis on third-party sites (web searching).
Table 16: Companies’ Use of Marketing Models
Marketing Model Uses
17
Number of Companies
In Use
Research
Proof of
Concept
Prototype
None (N/A)
Targeted Online Advertising
56
2
3
0
132
Identification of Recipients of
Mail or Phone Advertising
42
2
0
0
149
Provision of Offers to Existing
Customers
42
2
3
11
135
Identification of Potential
Customer Groups
19
3
7
0
164
Demand Modeling
7
10
0
0
176
Direct Online Sales
41
5
0
0
147
Other Marketing-Related
Functions
46
10
0
3
134
Many of the marketing models are automated with no human intervention on execution. Marketing
models are mostly automated when used for targeted online marketing (136 models), direct online sales
(88), provision of offers to existing customers (56), and other marketing-related functions (75). When
identifying recipients of mail or phone advertising, there is most often augmentation (68), where a model
provides an answer and advises the human who is making the decision. When identifying potential
16
For definitions, refer to Appendix D: Definitions Specific to Marketing.
17
For definitions, refer to Appendix A: Guidance for Questions in Each Operational Area: Rating, Underwriting, Claims, Fraud
Detection, Marketing, Loss Prevention.
21
customer groups, the number of models is evenly split between all three levels of decision-making.
Demand modeling is evenly split between augmentation and support to the human. (Refer to Table 17.)
Table 17: Level of Decision-Making by Use of Marketing Models
Marketing Model Uses
18
Number of Models (In Use or Under Construction) by
Level of Decisions influenced by AI/ML
Automation*
Augmentation*
Support*
Other
Targeted Online Advertising
136
45
23
1
Identification of Recipients of Mail
or Phone Advertising
28
68
23
1
Provision of Offers to Existing
Customers
56
27
24
1
Identification of Potential Customer
Groups
32
28
22
1
Demand Modeling
2
13
14
0
Direct Online Sales
88
40
12
5
Other Marketing-Related Functions
75
23
16
2
*“Automation” was defined as no human intervention on execution. “Augmentation” was defined as a model that suggests an
answer and advises the human making a decision. “Support” was defined as a model that provides information but does not
suggest a decision or action.
Marketing models being used by insurance companies are equally developed in-house (with or without
third-party assistance) and purchased from a third party. Two exceptions are that third-party models are
used for targeted online advertising, and in-house models are used for the provision of offers to existing
customers. (Refer to Table 18.)
Table 18: Marketing Model Sources by Model Use
Marketing Model Uses
19
Model Source
In-
House
In-
House
Third-
Party
Third-
Party
Total Total
#
%
#
%
#
%
Targeted Online Advertising
19
9%
186
91%
205
100%
Identification of Recipients of Mail
or Phone Advertising
46
38
74
62
120
100
Provision of Offers to Existing
Customers
78
72
30
28
108
100
Identification of Potential Customer
Groups
48
58
35
42
83
100
Demand Modeling
16
55
13
45
29
100
Direct Online Sales
76
52
69
48
145
100
Other Marketing-Related Functions
69
59
47
41
116
100
18
For definitions, See Appendix A: "Guidance for Questions in Each Operational Area: Rating, Underwriting, Claims, Fraud
Detection, Marketing, Loss Prevention"
19
For definitions, See Appendix A: "Guidance for Questions in Each Operational Area: Rating, Underwriting, Claims, Fraud
Detection, Marketing, Loss Prevention"
22
Data Elements
The survey was limited to the use of the “more advanced” AI/ML. Therefore, the data element information
here does not represent the industry’s entire use of big data (which would require adding in the data
element information from excluded models (e.g., regression-type models, etc.).
For marketing, the following five data elements were the most frequently reported as being used:
• Demographic (79 companies)
• Education (42)
• Consumer or other type of “score” (42)
• Geocoding (40)
• Vehicle-specific data (39)
There are at least some companies using driving behavior (33 companies), occupation (32), online media
(29), loss experience (21), personal financial information (13), telematics (11), job stability (11), income
(4), and natural catastrophe (1) for fraud-detection purposes. Companies also reported using “other”
nontraditional data elements (26). (Refer to Table 19.)
Table 19: Companies’ Use of Marketing Data Elements
Marketing Data Elements
20
Number of Companies Using/Not Using the
Data Element in a Marketing AI/ML Model*
Yes
No
Blank
Criminal Conviction
(Excluding Auto-Related Convictions)
0
128
65
Demographic
79
48
66
Driving Behavior
33
94
66
Education
42
85
66
Vehicle-Specific Data
39
88
66
Facial Detection/Recognition/Analysis
0
127
66
Geocoding
40
87
66
Natural Catastrophe
1
126
66
Job Stability
11
116
66
Income
4
123
66
Occupation
32
95
66
Personal Financial Information
13
114
66
Loss Experience
21
106
66
Medical
0
127
66
Online Media
29
98
66
Telematics
11
116
66
Voice Analysis
0
127
66
Consumer or Other Type of “Score”
42
99
52
Other Nontraditional Data Elements
26
101
66
*The question is not whether the data element is used, but only whether the data element is used in an
AI/ML model.
20
For definitions, see Appendix H: “Data Use Table Definitions.”
23
There are differences in data sources for the data elements. For example, demographic, driving behavior,
education, geocoding, job stability, occupation, loss experience, and telematics are most often sourced
externally, while income, personal financial, and consumer or other “score” were more frequently sourced
internally. Other data elements, such as vehicle-specific data and online media, are sourced almost equally
from both external and internal data. (Refer to Table 20.)
Table 20: Marketing Model Sources (Internal vs. Third Party) by Data Elements
Marketing Data Elements
21
Number of Companies Using the Data Element
in a Marketing AI/ML model*
Internal
Data
Source
External
Data
Source
Both Internal
and External
Data Sources
Blank
Criminal Conviction
(Excluding Auto-Related
Convictions)
0
0
0
193
Demographic
40
14
25
114
Driving Behavior
20
9
4
160
Education
21
6
15
151
Vehicle-Specific Data
20
14
5
154
Facial Detection/Recognition/
Analysis
0
0
0
193
Geocoding
36
8
0
149
Natural Catastrophe
0
1
0
192
Job Stability
11
0
0
182
Income
0
4
0
189
Occupation
22
10
0
161
Personal Financial Information
0
6
7
180
Loss Experience
13
1
7
172
Medical
0
0
0
193
Online Media
14
15
0
164
Telematics
11
0
0
182
Voice Analysis
0
0
0
193
Consumer or Other Type of “Score”
11
31
0
151
Other Nontraditional Data Elements
24
2
0
167
A few companies use a consumer or other type of “score” as an input for the following marketing data
elements: demographic (5 companies), occupation (4), and personal financial information (2). One
company uses consumer or other type of “score” as an input for the following market data elements:
driving behavior, education, vehicle-specific data, income, and online media. (Refer to Table 21.)
21
For definitions, see Appendix H: “Data Use Table Definitions.”
24
Table 21: Companies’ Use of Consumer or Other Type of “Score” as an Input for Marketing Data Elements
Marketing Data Elements
22
Number of Companies Using a Consumer or
Other Type of “Score” as an Input
Yes
No
Blank
Criminal Conviction
(Excluding Auto-Related Convictions)
0
46
147
Demographic
5
61
127
Driving Behavior
1
45
147
Education
1
60
132
Vehicle-Specific Data
1
46
146
Facial Detection/Recognition/Analysis
0
46
147
Geocoding
0
59
134
Natural Catastrophe
0
46
147
Job Stability
0
46
147
Income
1
46
146
Occupation
4
40
149
Personal Financial Information
2
45
146
Loss Experience
0
46
147
Medical
0
46
147
Online Media
1
59
133
Telematics
0
47
146
Voice Analysis
0
46
147
Consumer or Other Type of “Score”
Other Nontraditional Data Elements
0
60
133
Refer to the “Customer Data Correction,” “Governance,” and “Third-Party” sections of this report for
additional data analysis regarding company operations areas.
COMPANY OPERATION: RATING
23
Out of 193 reporting companies, 52 companies reported using AI/ML for rating operations, and 25
reported having models under construction.
Rating Model Uses
While numbers are small, the most common use case within the rating area of operations is Rating Class
determination, with 37 companies indicating they have models either in use (23 companies) or under
construction (14). The second most common use case within the rating area of operations is numerical
relativity determination, with 27 companies indicating that they have models either in use (19) or under
construction (8). Only seven (7) companies reported using AI/ML models for retention modeling, with six
(6) companies reporting models under construction for the area. No companies reported using or having
plans to use AI/ML models for price optimization.
22
For definitions, see Appendix H: “Data Use Table Definitions.”
23
For definitions, See Appendix E: Definitions Specific to Rating
25
The uses of rating models identified in Table 22 were options that could be selected in the survey
template. Companies noted some additional uses of rating models in their write-in comments: telematics,
close rate expectation, loss development expectation, loss performance monitoring, ground-up loss
prediction, and frequency trend forecasting. Additional write-ins were policy application pre-filling and
bad-debt mitigation.
Table 22: Companies’ Use of Rating Models
Rating Model Uses
24
Number of Companies
In Use
Research
Proof of
Concept
Prototype
None (N/A)
Rating Class Determination
23
9
0
5
156
Price Optimization
0
0
0
0
193
Retention Modeling
7
3
0
3
180
Numerical Relativity
Determination
19
4
0
4
166
Other Rate-Related Functions
24
4
0
0
165
Most of the rating models are automated, requiring no human intervention for execution. The types of
models most often automated are retention models and other rate-related functions. Rating Class
determinations and numerical relativity determinations tend to be augmented, where the model suggests
an answer and advises a human who is making a decision. (Refer to Table 23.)
Table 23: Level of Decision-Making by Use of Rating Models
Rating Model Uses
25
Number of Models (In Use or Under Construction) by
Level of Decisions Influenced by AI/ML
Automation*
Augmentation*
Support*
Other
Rating Class Determination
9
33
8
3
Price Optimization
0
0
0
0
Retention Modeling
22
0
5
2
Numerical Relativity Determination
10
21
9
2
Other Rate-Related Functions
29
2
27
0
*“Automation” was defined as no human intervention on execution. “Augmentation” was defined as a model that suggests an
answer and advises the human making a decision. “Support” was defined as a model that provides information but does not
suggest a decision or action.
Rating models tend to be developed by companies and not third parties. About 75%–90% of the rating
models are developed by companies “in-house.” (Refer to Table 24.)
24
For definitions, refer to Appendix A: Guidance for Questions in Each Operational Area: Rating, Underwriting, Claims, Fraud
Detection, Marketing, Loss Prevention.
25
For definitions, See Appendix A: Guidance for Questions in Each Operational Area: Rating, Underwriting, Claims, Fraud
Detection, Marketing, Loss Prevention.
26
Table 24: Rating Model Sources by Model Use
Rating Model Uses
26
Model Source
In-
House
In-
House
Third-
Party
Third-
Party
Total Total
#
%
#
%
#
%
Rating Class Determination
47
89%
6
11%
53
100%
Price Optimization
0
0
0
0
0
100
Retention Modeling
25
86
4
14
29
100
Numerical Relativity Determination
33
79
9
21
42
100
Other Rate-Related Functions
44
76
14
24
58
100
Data Elements
The survey was limited to the use of the “more advanced” AI/ML. Therefore, the data element information
here does not represent the industry’s entire use of big data (which would require adding in the data
element information from excluded models; e.g., regression-type models, etc.).
For rating, the following five data elements were the most frequently reported as being used for AI/ML:
• Vehicle-specific data (40 companies)
• Loss experience (35)
• Driving behavior (33)
• Demographic (30)
• Telematics (27)
There are at least some companies using vehicle-specific data (39 companies), driving behavior (33),
occupation (32), online media (29), loss experience (21), personal financial information (13), telematics
(11), job stability (11), income (4), and natural catastrophe (1) for fraud-detection purposes. Companies
also reported using “other” nontraditional data elements (26). (Refer to Table 25.)
Table 25: Companies’ Use of Rating Data Elements
Rating Data Elements
27
Number of Companies Using/Not Using the
Data Element in a Rating AI/ML Model*
Yes
No
Blank
Criminal Conviction
(Excluding Auto-Related Convictions)
0
113
80
Demographic
30
83
80
Driving Behavior
33
80
80
Education
7
106
80
Vehicle-Specific Data
40
73
80
Facial Detection/Recognition/Analysis
0
113
80
Geocoding
11
102
80
26
For definitions, refer to Appendix A: Guidance for Questions in Each Operational Area: Rating, Underwriting, Claims, Fraud
Detection, Marketing, Loss Prevention.
27
For definitions, refer to Appendix H: Data Use Table Definitions.
27
Rating Data Elements
27
Number of Companies Using/Not Using the
Data Element in a Rating AI/ML Model*
Yes
No
Blank
Natural Catastrophe
6
107
80
Job Stability
0
113
80
Income
0
113
80
Occupation
6
107
80
Personal Financial Information
14
99
80
Loss Experience
35
78
80
Medical
0
113
80
Online Media
0
113
80
Telematics
27
86
80
Voice Analysis
0
113
80
Consumer or Other Type of “Score”
21
94
78
Other Nontraditional Data Elements
6
107
80
*The question is not whether the data element is used, but only whether the data element is used in an AI/ML
model.
There are differences in data sources for the data elements. For example, driving behavior, telematics,
natural catastrophe, and a consumer or other “score” tend to be externally sourced, while vehicle-specific
data, loss experience, and occupation are more frequently sourced internally. Other data elements
—such
as geocoding, personal financial information, and demographic information
—are sourced from both
external and internal data. (Refer to Table 26.)
Table 26: Rating Model Sources (Internal vs. Third Party) by Data Elements
Rating Data Elements
28
Number of Companies Using the Data Element
in a Rating AI/ML Model*
Internal
Data
Source
External
Data
Source
Both Internal
and External
Data Sources
Blank
Criminal Conviction
(Excluding Auto-Related Convictions)
0
0
0
193
Demographic
11
6
13
163
Driving Behavior
0
27
6
160
Education
7
0
0
186
Vehicle-Specific Data
20
6
14
153
Facial Detection/Recognition/Analysis
0
0
0
193
Geocoding
5
6
0
182
Natural Catastrophe
0
6
0
187
Job Stability
0
0
0
193
Income
0
0
0
193
Occupation
6
0
0
187
Personal Financial Information
7
7
0
179
Loss Experience
26
0
9
158
28
For definitions, refer to Appendix H: Data Use Table Definitions.
28
Rating Data Elements
28
Number of Companies Using the Data Element
in a Rating AI/ML Model*
Internal
Data
Source
External
Data
Source
Both Internal
and External
Data Sources
Blank
Medical
0
0
0
193
Online Media
0
0
0
193
Telematics
1
9
17
166
Voice Analysis
0
0
0
193
Consumer or Other Type of “Score”
4
17
0
172
Other Nontraditional Data Elements
0
6
0
187
Most companies do not use a consumer or other type of score as a data element. Table 27 illustrates that
the only rating data elements for which consumer or other type of “score” was listed as an input are as
follows: demographic (4 companies), driving behavior (4), vehicle specific data (1), and personal financial
information (4). The numbers are low; recall the AI/ML definition excludes the most-often used rating
models.
Table 27: Companies’ Use of Consumer or Other Type of “Score” as an Input for Rating Data Elements
Rating Data Elements
29
Number of Companies Using a Consumer or
Other Type of “Score” as an Input
Yes
No
Blank
Criminal Conviction
(Excluding Auto-Related Convictions)
0
31
162
Demographic
4
36
153
Driving Behavior
4
29
160
Education
0
31
162
Vehicle-Specific Data
1
32
160
Facial Detection/Recognition/Analysis
0
31
162
Geocoding
0
31
162
Natural Catastrophe
0
33
160
Job Stability
0
31
162
Income
0
31
162
Occupation
0
31
162
Personal Financial Information
4
33
156
Loss Experience
0
37
156
Medical
0
31
162
Online Media
0
31
162
Telematics
0
47
146
Voice Analysis
0
31
162
Consumer or Other Type of “Score”
Other Nontraditional Data Elements
0
36
157
29
For definitions, refer to Appendix H: Data Use Table Definitions.
29
Refer to the “Customer Data Correction, “Governance,” and “Third-Party” sections of this report for
additional data analysis regarding company operations areas.
COMPANY OPERATION: UNDERWRITING
30
Out of 193 reporting companies, 34 companies reported using AI/ML for fraud-detection operations, and
25 reported having models under construction.
Underwriting Model Uses
Most underwriting models in use are reported in the “all other” use category of other underwriting-
related functions. There are 14 models under construction for the use of automated denial. No companies
reported using or having plans to use AI/ML models for underwriting tier determination or to automate
processing through the agency channel. We suspect the reason (there are no reported models) stems
from the exclusion of the most-often used models in the AI/ML definition.
The uses of underwriting models identified in Table 28 were options that could be selected in the survey
template. Companies noted some additional uses of underwriting models in their write-in comments:
renewal evaluations, the need for renewal inspections, reinstatements, motor vehicle report (MVR)
ordering, policy characteristics verification, quote display determination, rating facility determination,
work triage, telematics app discount eligibility, policy anomaly detection, production implementation,
pre- and post-underwriting fraud detection, network detection, premium audits, and book evaluation.
Table 28: Companies’ Use of Underwriting Models
Underwriting Model Uses
31
Number of Companies
In Use
Research
Proof of
Concept
Prototype
None (N/A)
Automated Approval
1
3
0
0
189
Automated Denial
0
3
0
11
179
Underwriting Tier
Determination
0
0
0
0
193
Company Placement
0
2
0
0
191
Input into Non-Automated
Approval Decision
1
0
0
1
191
Input into Non-Automated
Denial Decision
0
0
0
3
190
Automate Processing Through
the Agency Channel
0
0
0
0
193
Other Underwriting-Related
Functions
33
3
0
2
155
30
For definitions, refer to Appendix F: Definitions Specific to Underwriting.
31
For definitions, refer to Appendix A: Guidance for Questions in Each Operational Area: Rating, Underwriting, Claims, Fraud
Detection, Marketing, Loss Prevention.
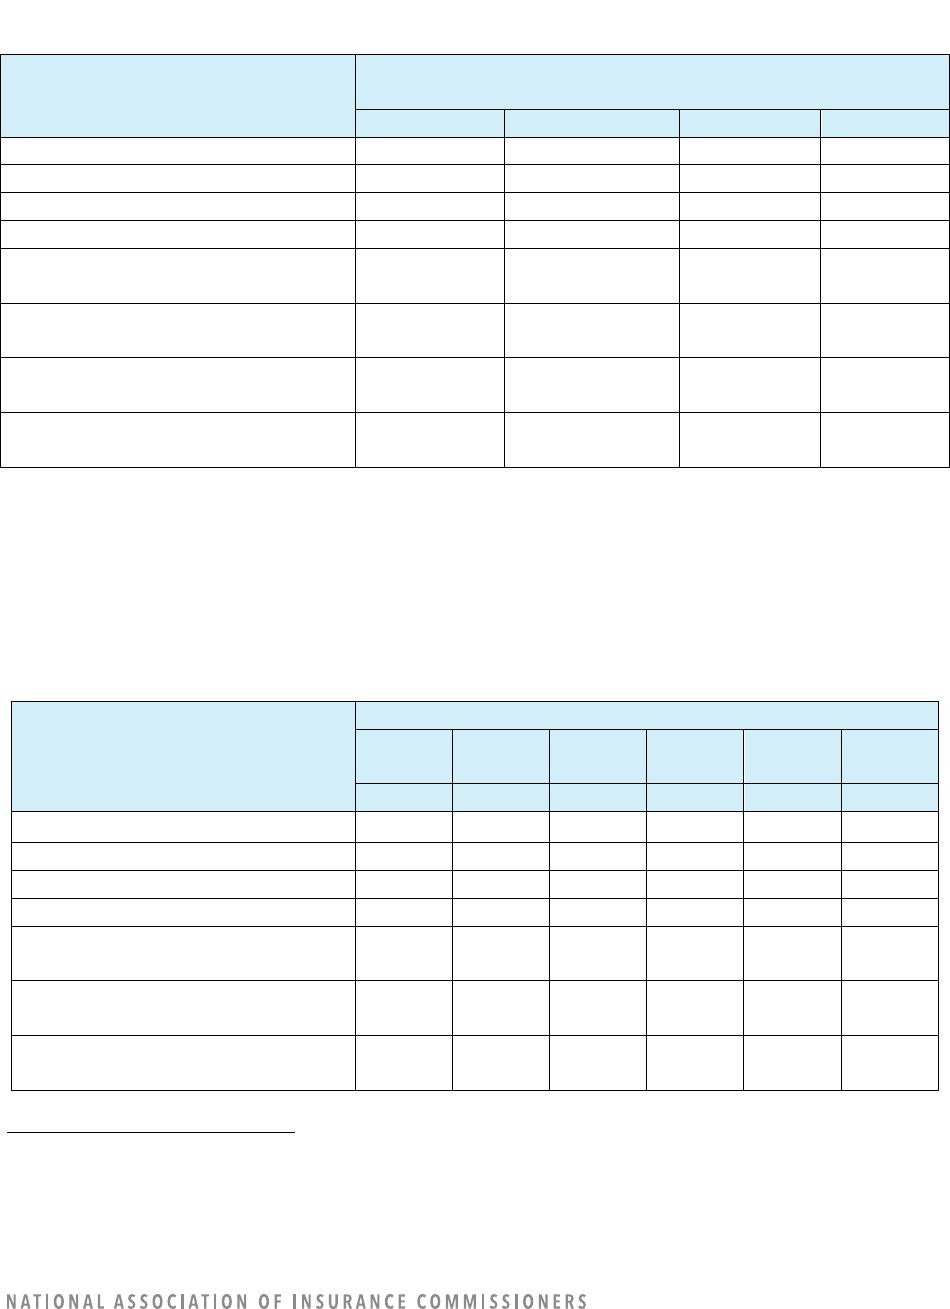
30
Underwriting models are evenly split between automation, augmentation, and support. (Refer to Table
29.)
Table 29: Level of Decision-Making by Use of Underwriting Models
Underwriting Model Uses
32
Number of Models (In Use or Under Construction) by
Level of Decisions Influenced by AI/ML
Automation*
Augmentation*
Support*
Other
Automated Approval
0
1
0
3
Automated Denial
11
1
0
2
Underwriting Tier Determination
0
0
0
0
Company Placement
0
0
0
2
Input into Non-Automated Approval
Decision
0
1
2
0
Input into Non-Automated Denial
Decision
0
3
0
0
Automate Processing Through the
Agency Channel
0
0
0
0
Other Underwriting-Related
Functions
28
27
23
0
*“Automation” was defined as no human intervention on execution. “Augmentation” was defined as a model that suggests an
answer and advises the human making a decision. “Support” was defined as a model that provides information but does not
suggest a decision or action.
Most underwriting models are developed by companies (67%–100%). However, companies tend to use
more third-party models for input into non-automated approval decisions (67%). (Refer to Table 30.)
Table 30: Underwriting Model Sources by Model Use
Underwriting Model Uses
33
Model Source
In-
House
In-
House
Third-
Party
Third-
Party
Total Total
#
%
#
%
#
%
Automated Approval
3
75%
1
25%
4
100%
Automated Denial
13
93
1
7
14
100
Underwriting Tier Determination
0
0
0
0
0
100
Company Placement
2
100
0
0
2
100
Input into Non-Automated
Approval Decision
1
33
2
67
3
100
Input into Non-Automated Denial
Decision
2
67
1
33
3
100
Automate Processing Through the
Agency Channel
0
0
0
0
0
100
32
For definitions, refer to Appendix A: Guidance for Questions in Each Operational Area: Rating, Underwriting, Claims, Fraud
Detection, Marketing, Loss Prevention.
33
For definitions, refer to Appendix A: Guidance for Questions in Each Operational Area: Rating, Underwriting, Claims, Fraud
Detection, Marketing, Loss Prevention.
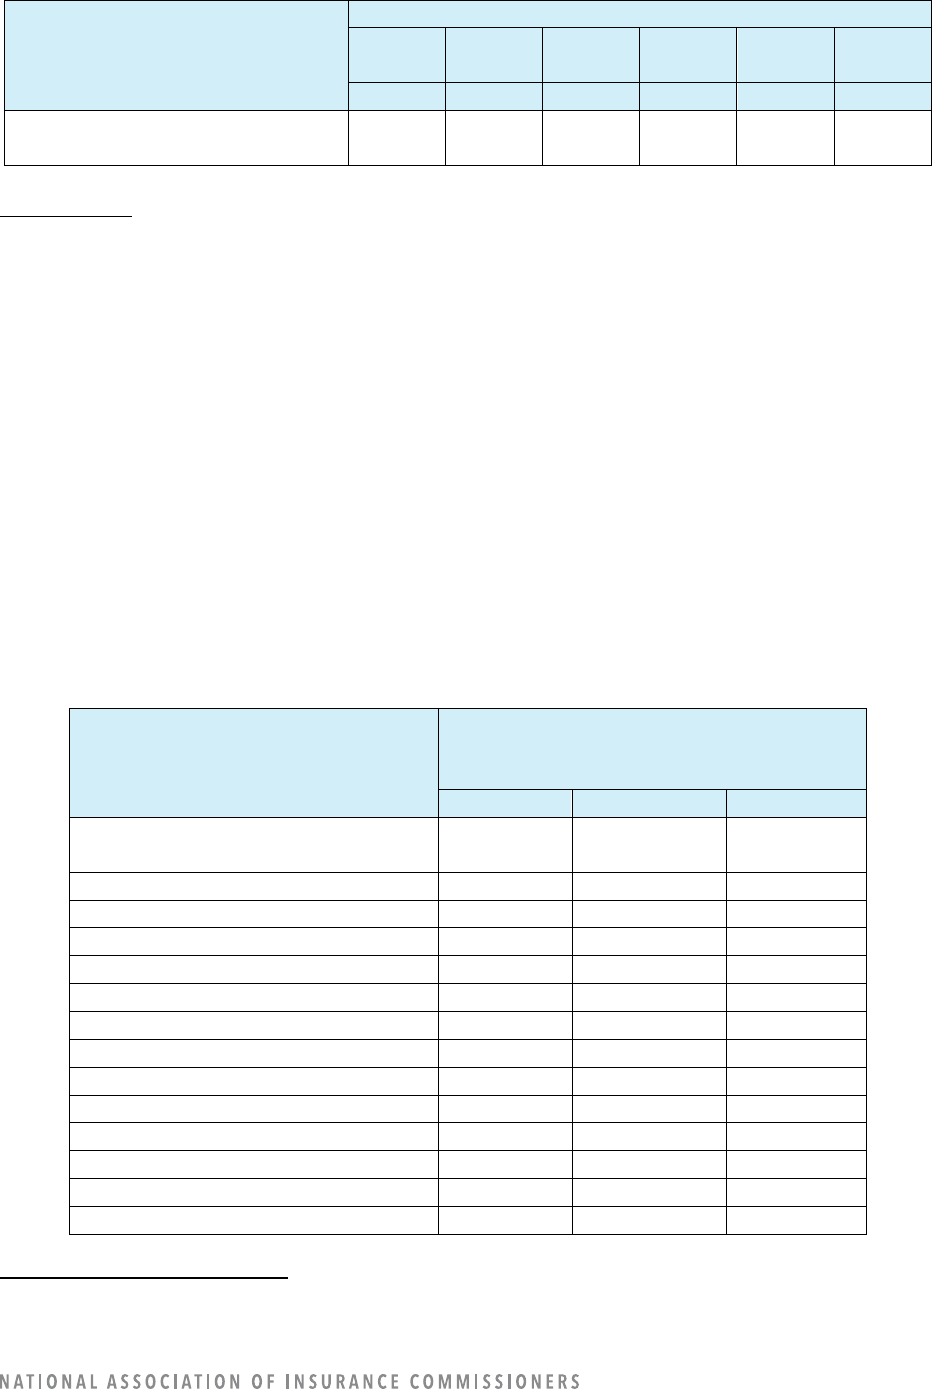
31
Underwriting Model Uses
33
Model Source
In-
House
In-
House
Third-
Party
Third-
Party
Total Total
#
%
#
%
#
%
Other Underwriting-Related
Functions
72
92
6
8
78
100
Data Elements
The survey was limited to the use of the “more advanced” AI/ML. Therefore, the data element information
here does not represent the industry’s entire use of big data (which would require adding in the data
element information from excluded models (e.g., regression-type models, etc.).
The following four data elements were the most frequently reported as being used for AI/ML underwriting
systems:
• Vehicle-specific data (35 companies)
• Demographic (28)
• Consumer or other type of “score” (28)
• Loss experience (20)
There are at least some companies using the following data elements for AI/underwriting systems: driving
behavior (12 companies), education (12), geocoding (12), natural catastrophe (9), telematics (5), personal
financial information (2), and occupation (1). (Refer to Table 31.)
Table 31: Companies’ Use of Underwriting Data Elements
Underwriting Data Elements
34
Number of Companies Using/Not Using the
Data Element in an Underwriting AI/ML
Model*
Yes
No
Blank
Criminal Conviction
(Excluding Auto-Related Convictions)
0
90
103
Demographic
28
62
103
Driving Behavior
12
78
103
Education
12
78
103
Vehicle-Specific Data
35
55
103
Facial Detection/Recognition/Analysis
0
90
103
Geocoding
12
78
103
Natural Catastrophe
9
81
103
Job Stability
0
90
103
Income
0
90
103
Occupation
1
89
103
Personal Financial Information
2
88
103
Loss Experience
20
70
103
Medical
0
90
103
34
For definitions, refer to Appendix H: Data Use Table Definitions.
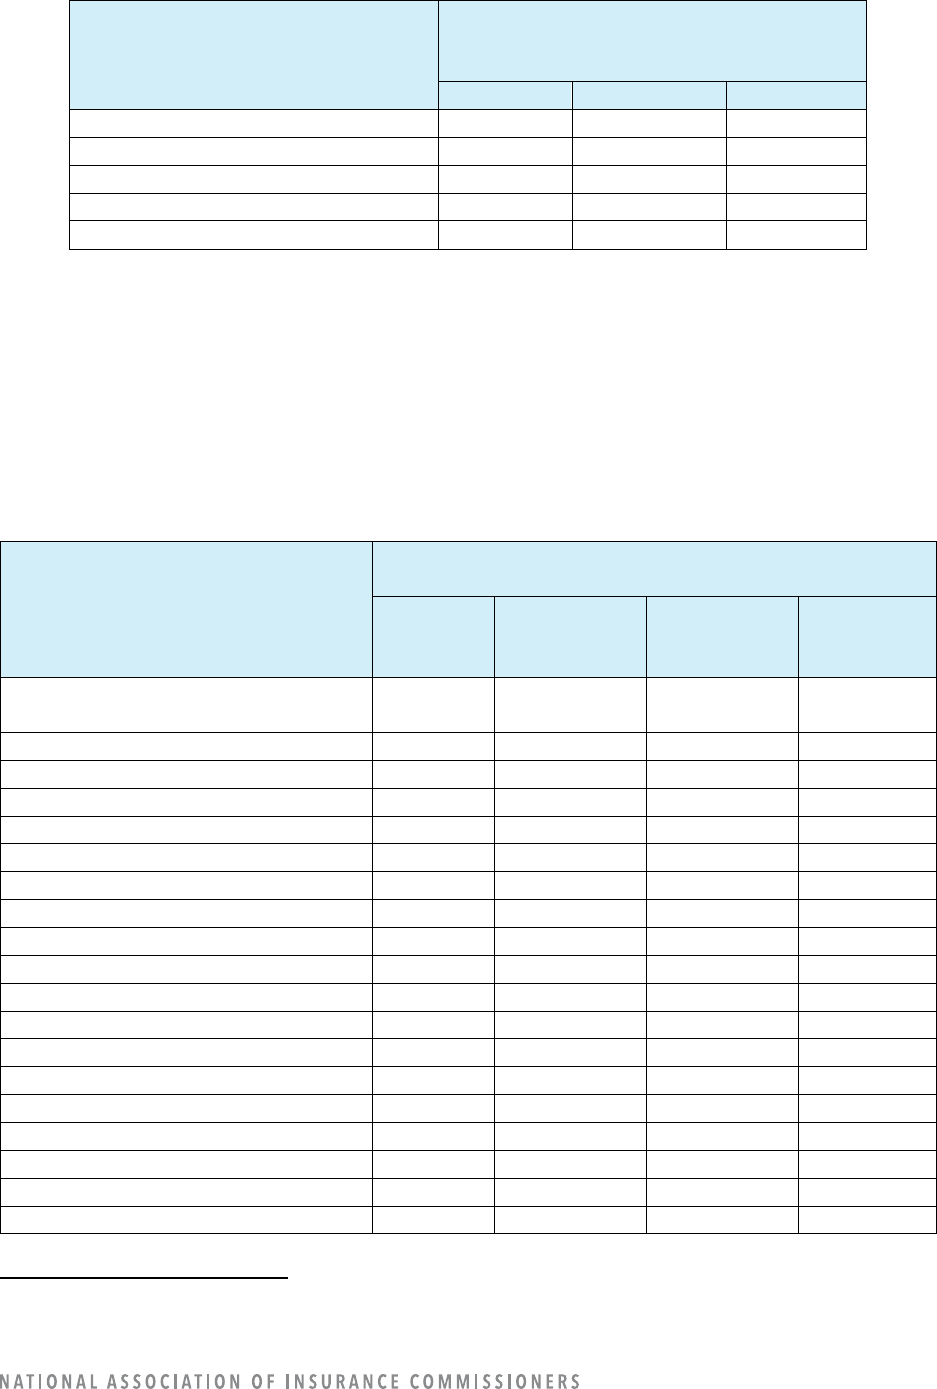
32
Underwriting Data Elements
34
Number of Companies Using/Not Using the
Data Element in an Underwriting AI/ML
Model*
Yes
No
Blank
Online Media
0
90
103
Telematics
5
85
103
Voice Analysis
0
90
103
Consumer or Other Type of “Score”
28
68
97
Other Nontraditional Data Elements
0
90
103
*The question is not whether the data element is used, but only whether the data element is used in an
AI/ML model.
There are differences in data sources for the data elements. For example, driving behavior and consumer
or other type of “score” are almost always sourced externally (almost 100% externally sourced either fully
or partially), while vehicle-specific data was more frequently sourced internally (69% internally sourced).
Other data elements, such as loss experience and demographic information, are sourced from both
external and internal data. (Refer to Table 32.)
Table 32: Underwriting Model Sources (Internal vs. Third Party) by Data Elements
Underwriting Data Elements
35
Number of Companies Using the Data Element
in an Underwriting AI/ML Model*
Internal
Data
Source
External
Data
Source
Both Internal
and External
Data Sources
Blank
Criminal Conviction
(Excluding Auto-Related Convictions)
0
0
0
193
Demographic
14
0
14
165
Driving Behavior
1
10
1
181
Education
12
0
0
181
Vehicle-Specific Data
24
2
9
158
Facial Detection/Recognition/Analysis
0
0
0
193
Geocoding
3
7
2
181
Natural Catastrophe
1
7
1
184
Job Stability
0
0
0
193
Income
0
0
0
193
Occupation
1
0
0
192
Personal Financial Information
0
1
1
191
Loss Experience
4
0
16
173
Medical
0
0
0
193
Online Media
0
0
0
193
Telematics
2
2
1
188
Voice Analysis
0
0
0
193
Consumer or Other Type of “Score”
1
26
1
165
Other Nontraditional Data Elements
0
0
0
193
35
For definitions, refer to Appendix H: Data Use Table Definitions.
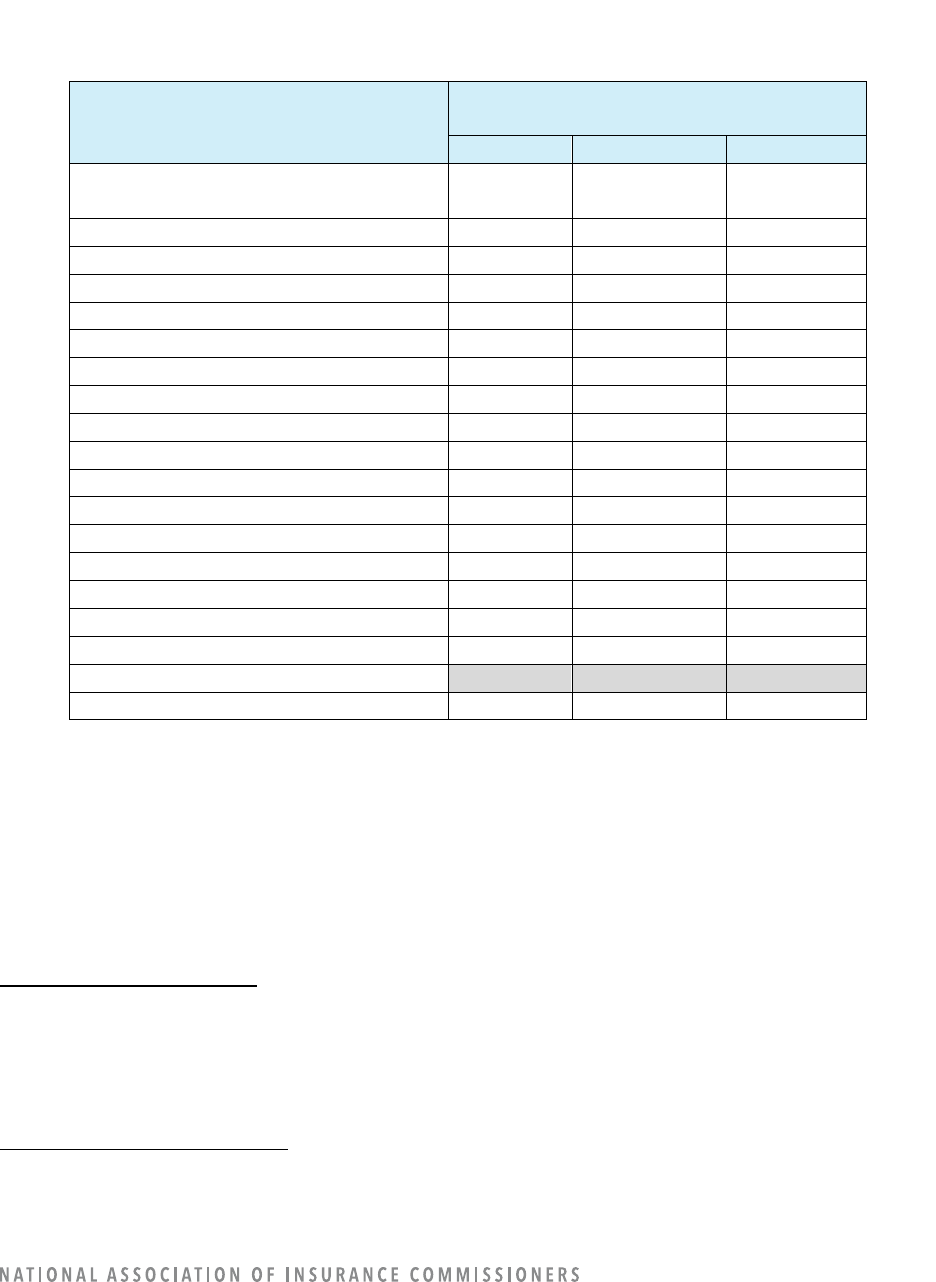
33
There were no companies reporting the use of consumer or other type of “score” as an input for
underwriting data elements. (Refer to Table 33.)
Table 33: Companies’ Use of Consumer or Other Type of “Score” as an Input for Underwriting Data
Elements
Underwriting Data Elements
36
Number of Companies Using a Consumer or
Other Type of “Score” as an Input
Yes
No
Blank
Criminal Conviction
(Excluding Auto-Related Convictions)
0
36
157
Demographic
0
33
160
Driving Behavior
0
36
157
Education
0
36
157
Vehicle-Specific Data
0
39
154
Facial Detection/Recognition/Analysis
0
36
157
Geocoding
0
38
155
Natural Catastrophe
0
36
157
Job Stability
0
36
157
Income
0
36
157
Occupation
0
36
157
Personal Financial Information
0
36
157
Loss Experience
0
37
156
Medical
0
36
157
Online Media
0
36
157
Telematics
0
36
157
Voice Analysis
0
36
157
Consumer or Other Type of “Score”
Other Nontraditional Data Elements
0
36
157
Refer to the “Customer Data Correction,” “Governance,” and “Third-Party” sections of this report for
additional data analysis regarding company operations areas.
COMPANY OPERATION: LOSS PREVENTION
37
Out of 193 reporting companies, three (3) companies reported using AI/ML for loss prevention operations,
and 12 reported having models under construction.
Loss Prevention Model Uses
Out of all the areas of company operations, the least number of companies use loss prevention models.
Only three (3) companies have AI/ML currently implemented in production. All three of those companies
are using AI/ML for the identification of high-risk customers. However, eight (8) companies are in the
36
For definitions, refer to Appendix H: Data Use Table Definitions.
37
For definitions, refer to Appendix G: Definitions Specific to Loss Prevention.
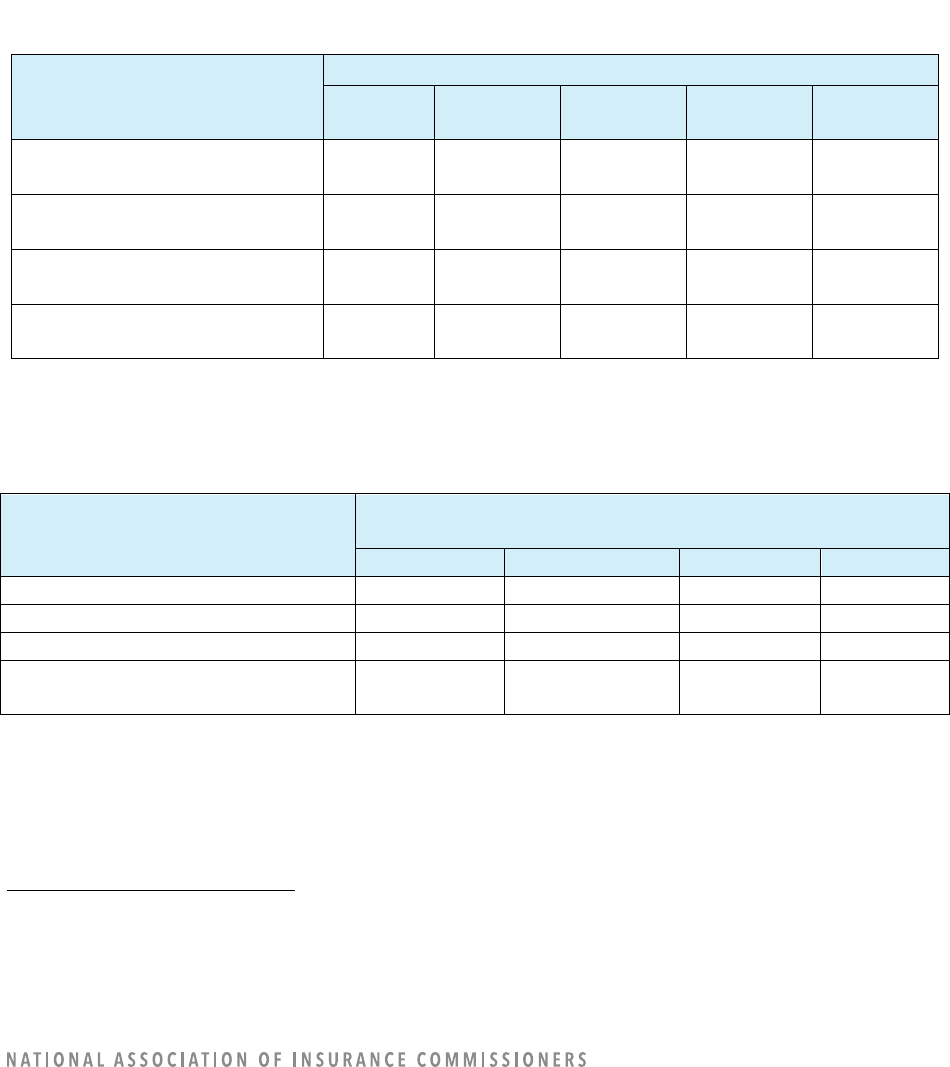
34
research phase, and one (1) company is in the prototype phase to use AI/ML for the identification of high-
risk customers.
Two (2) companies indicated that they are in the prototype phase for using AI/ML for risk-mitigation
advice to consumers, and one company is in the research phase for an other loss prevention-related
function. No companies indicated that they are or plan to use AI/ML for the determination of advance
payments.
The uses of loss prevention models identified in Table 34 were options that could be selected in the survey
template. Companies noted an additional use of loss prevention models in their write-in comments:
guidance for loss control inspections.
Table 34: Companies’ Use of Loss Prevention Models
Fraud-Detection Model Uses
38
Number of Companies
In Use
Research
Proof of
Concept
Prototype
None (N/A)
Identification of High-Risk
Customers
3
8
0
1
181
Risk-Mitigation Advice to
Consumers
0
0
0
2
191
Determination of Advance
Payments
0
0
0
0
193
Other Loss Prevention-Related
Functions
0
1
0
0
192
Almost all the loss prevention models are used for support. (Refer to Table 35.)
Table 35: Level of Decision-Making by Use of Loss Prevention Models
Loss Prevention Model Uses
39
Number of Models (In Use or Under Construction) by
Level of Decisions Influenced by AI/ML
Automation*
Augmentation*
Support*
Other
Identification of High-Risk Customers
0
1
11
0
Risk-Mitigation Advice to Consumers
0
0
0
2
Determination of Advance Payments
0
0
0
0
Other Loss Prevention-Related
Functions
0
0
1
0
*”Automation” was defined as no human intervention on execution. “Augmentation” was defined as a model that suggests an
answer and advises the human making a decision. “Support” was defined as a model that provides information but does not
suggest a decision or action.
Of the few reported loss prevention models, most are developed by companies in-house, and some are
developed by a third party. (Refer to Table 36.)
38
For definitions, refer to Appendix A: Guidance for Questions in Each Operational Area: Rating, Underwriting, Claims, Fraud
Detection, Marketing, Loss Prevention.
39
For definitions, refer to Appendix A: Guidance for Questions in Each Operational Area: Rating, Underwriting, Claims, Fraud
Detection, Marketing, Loss Prevention.
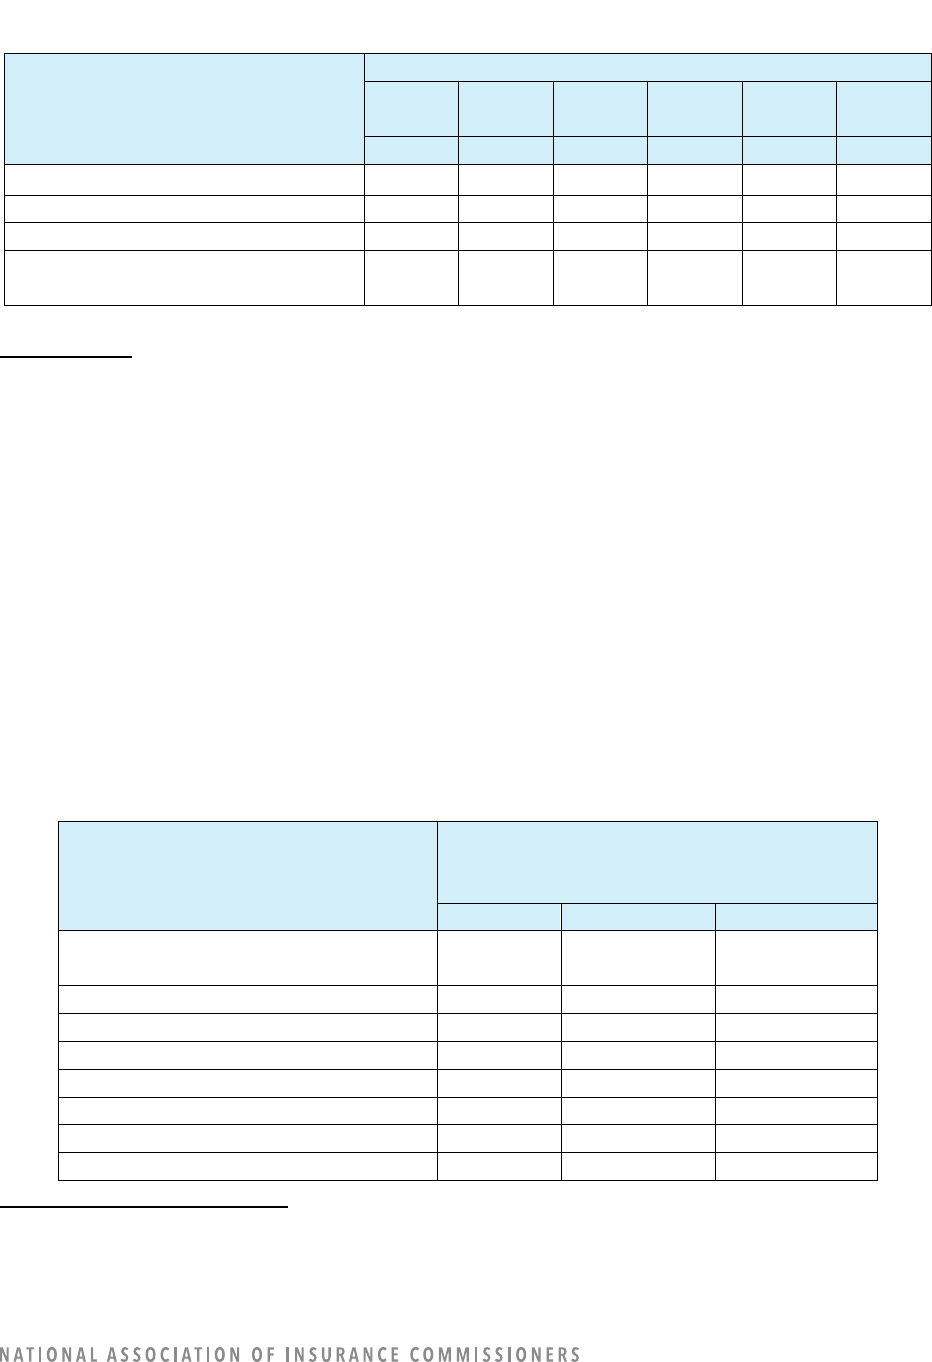
35
Table 36: Loss Prevention Model Sources by Model Use
Loss Prevention Model Uses
40
Model Source
In-
House
In-
House
Third-
Party
Third-
Party
Total Total
#
%
#
%
#
%
Identification of High-Risk Customers
8
67%
4
33%
12
100%
Risk-Mitigation Advice to Consumers
2
100
0
0
2
100
Determination of Advance Payments
0
0
0
0
0
100
Other Loss Prevention-Related
Functions
1
100
0
0
1
100
Data Elements
The survey was limited to the use of the “more advanced” AI/ML. Therefore, the data element information
here does not represent the industry’s entire use of big data (which would require adding in the data
element information from excluded models (e.g., regression-type models, etc.).
The following four data elements were the most frequently reported as being used for AI/ML loss
prevention:
• Driving behavior (10 companies)
• Vehicle-specific data (10)
• Geocoding (10)
• Loss experience (10)
There is one (1) company using demographic data. No other data elements are being used. (Refer to
Table 37.)
Table 37: Companies’ Use of Loss Prevention Data Elements
Loss Prevention Data Elements
41
Number of Companies Using/Not Using the
Data Element in a Loss Prevention AI/ML
Model*
Yes
No
Blank
Criminal Conviction
(Excluding Auto-Related Convictions)
0
59
134
Demographic
1
58
134
Driving Behavior
10
49
134
Education
0
59
134
Vehicle-Specific Data
10
49
134
Facial Detection/Recognition/Analysis
0
59
134
Geocoding
10
49
134
Natural Catastrophe
0
59
134
40
For definitions, refer to Appendix A: Guidance for Questions in Each Operational Area: Rating, Underwriting, Claims, Fraud
Detection, Marketing, Loss Prevention.
41
For definitions, refer to Appendix H: Data Use Table Definitions.
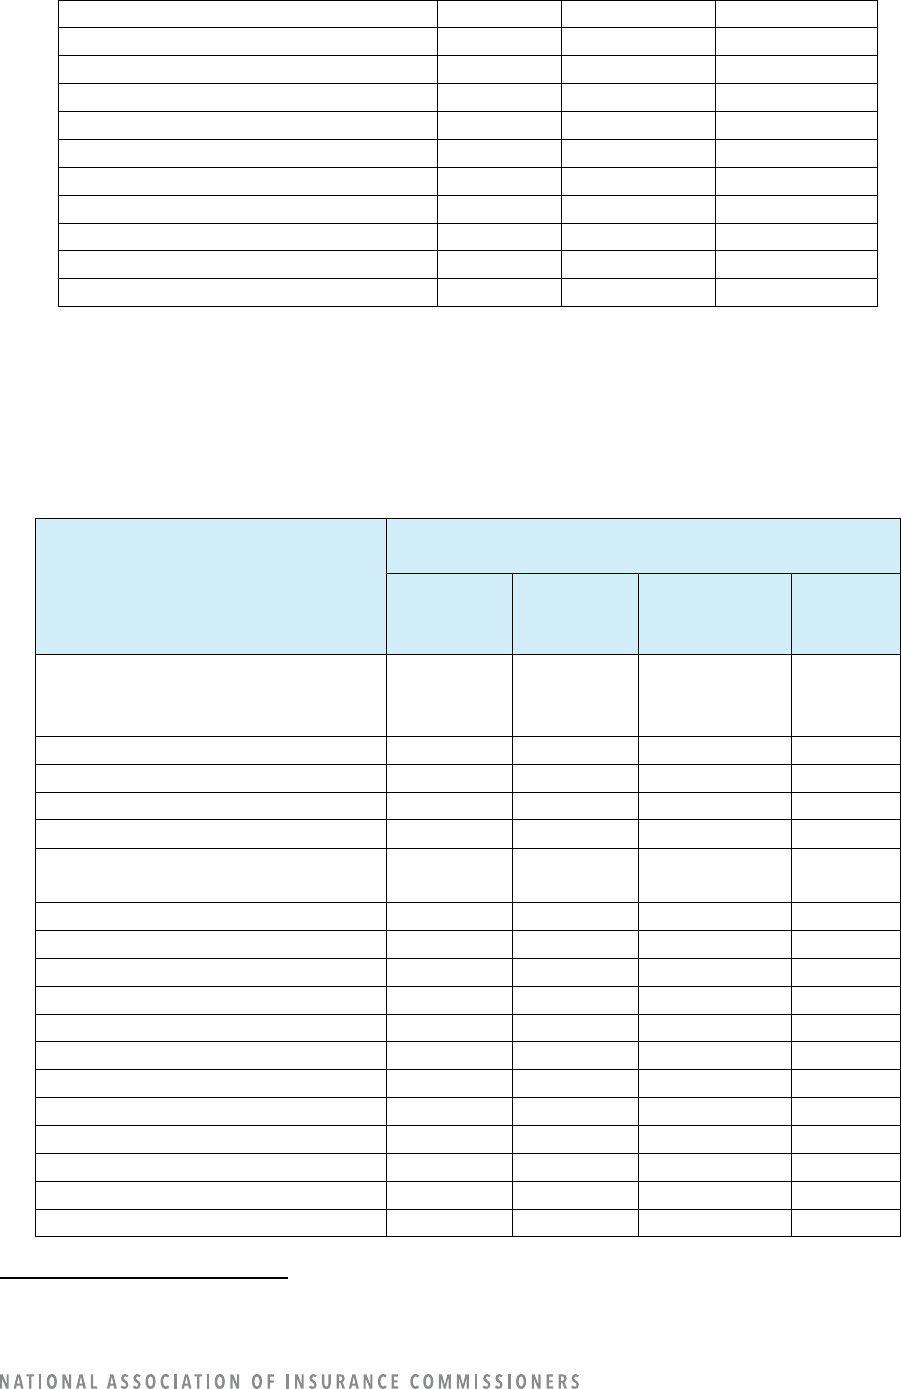
36
Job Stability
0
59
134
Income
0
59
134
Occupation
0
59
134
Personal Financial Information
0
59
134
Loss Experience
10
49
134
Medical
0
59
134
Online Media
0
59
134
Telematics
0
59
134
Voice Analysis
0
59
134
Consumer or Other Type of “Score”
0
66
127
Other Nontraditional Data Elements
0
59
134
*The question is not whether the data element is used, but only whether the data element is used in an
AI/ML model.
Almost all loss prevention data is internally sourced. Only geocoding data is sometimes also eternally
sourced. (Refer to Table 38.)
Table 38: Loss Prevention Model Sources (Internal vs. Third Party) by Data Elements
Loss Prevention Data Elements
42
Number of Companies Using the Data Element in a
Loss Prevention AI/ML Model*
Internal
Data
Source
External
Data
Source
Both Internal
and External
Data Sources
Blank
Criminal Conviction
(Excluding Auto-Related
Convictions)
0
0
0
193
Demographic
1
0
0
192
Driving Behavior
10
0
0
183
Education
0
0
0
193
Vehicle-Specific Data
10
0
0
183
Facial Detection/Recognition/
Analysis
0
0
0
193
Geocoding
7
3
0
183
Natural Catastrophe
0
0
0
193
Job Stability
0
0
0
193
Income
0
0
0
193
Occupation
0
0
0
193
Personal Financial Information
0
0
0
193
Loss Experience
10
0
0
193
Medical
0
0
0
193
Online Media
0
0
0
193
Telematics
0
0
0
193
Voice Analysis
0
0
0
193
Consumer or Other Type of “Score”
0
0
0
193
42
For definitions, refer to Appendix H: Data Use Table Definitions.
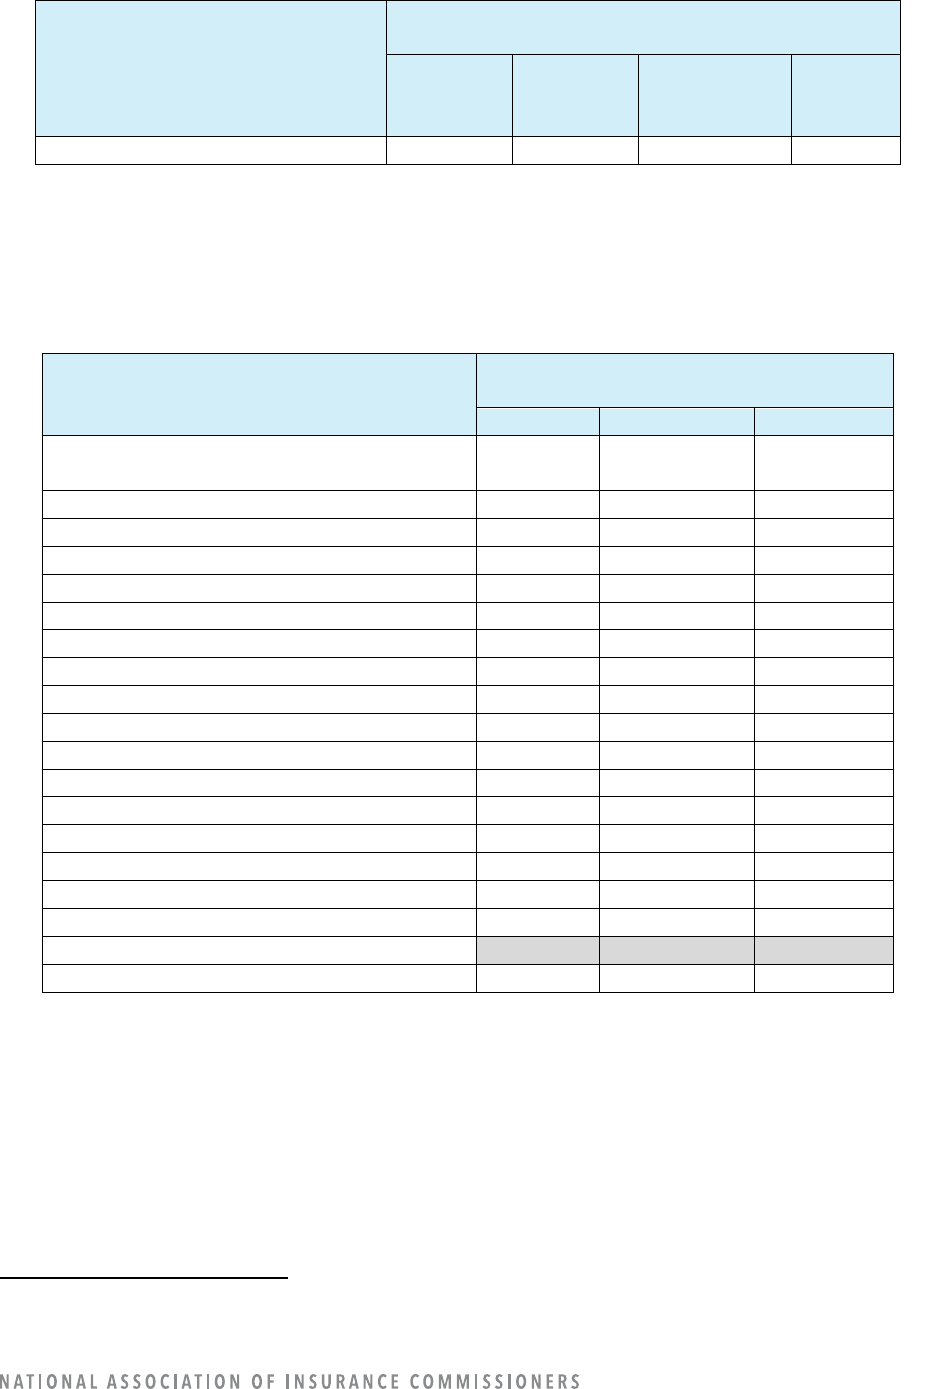
37
Loss Prevention Data Elements
42
Number of Companies Using the Data Element in a
Loss Prevention AI/ML Model*
Internal
Data
Source
External
Data
Source
Both Internal
and External
Data Sources
Blank
Other Nontraditional Data Elements
0
0
0
193
No companies indicated they are using a consumer or other type of “score” as an input for any of the data
elements. (Refer to Table 39.)
Table 39: Companies’ Use of Consumer or Other Type of “Score” as an Input for Loss Prevention Data
Elements
Loss Prevention Data Elements
43
Number of Companies Using a Consumer or
Other Type of “Score” as an Input
Yes
No
Blank
Criminal Conviction
(Excluding Auto-Related Convictions)
0
8
185
Demographic
0
8
185
Driving Behavior
0
15
178
Education
0
8
185
Vehicle-Specific Data
0
15
178
Facial Detection/Recognition/Analysis
0
8
185
Geocoding
0
15
178
Natural Catastrophe
0
8
185
Job Stability
0
8
185
Income
0
8
185
Occupation
0
8
185
Personal Financial Information
0
8
185
Loss Experience
0
15
178
Medical
0
8
185
Online Media
0
8
185
Telematics
0
8
185
Voice Analysis
0
8
185
Consumer or Other Type of “Score”
Other Nontraditional Data Elements
0
8
185
Refer to the “Customer Data Correction,” “Governance,” and “Third-Party” sections of this report for
additional data analysis regarding company operations areas.
CUSTOMER DATA CORRECTION
The following two consumer data correction questions ask if consumers are provided information about
data elements
—other than what is required by law. The number of companies not reporting is slightly
more than expected, based on the number of companies reporting non-use of AI/ML for a particular
43
For definitions, refer to Appendix H: Data Use Table Definitions.
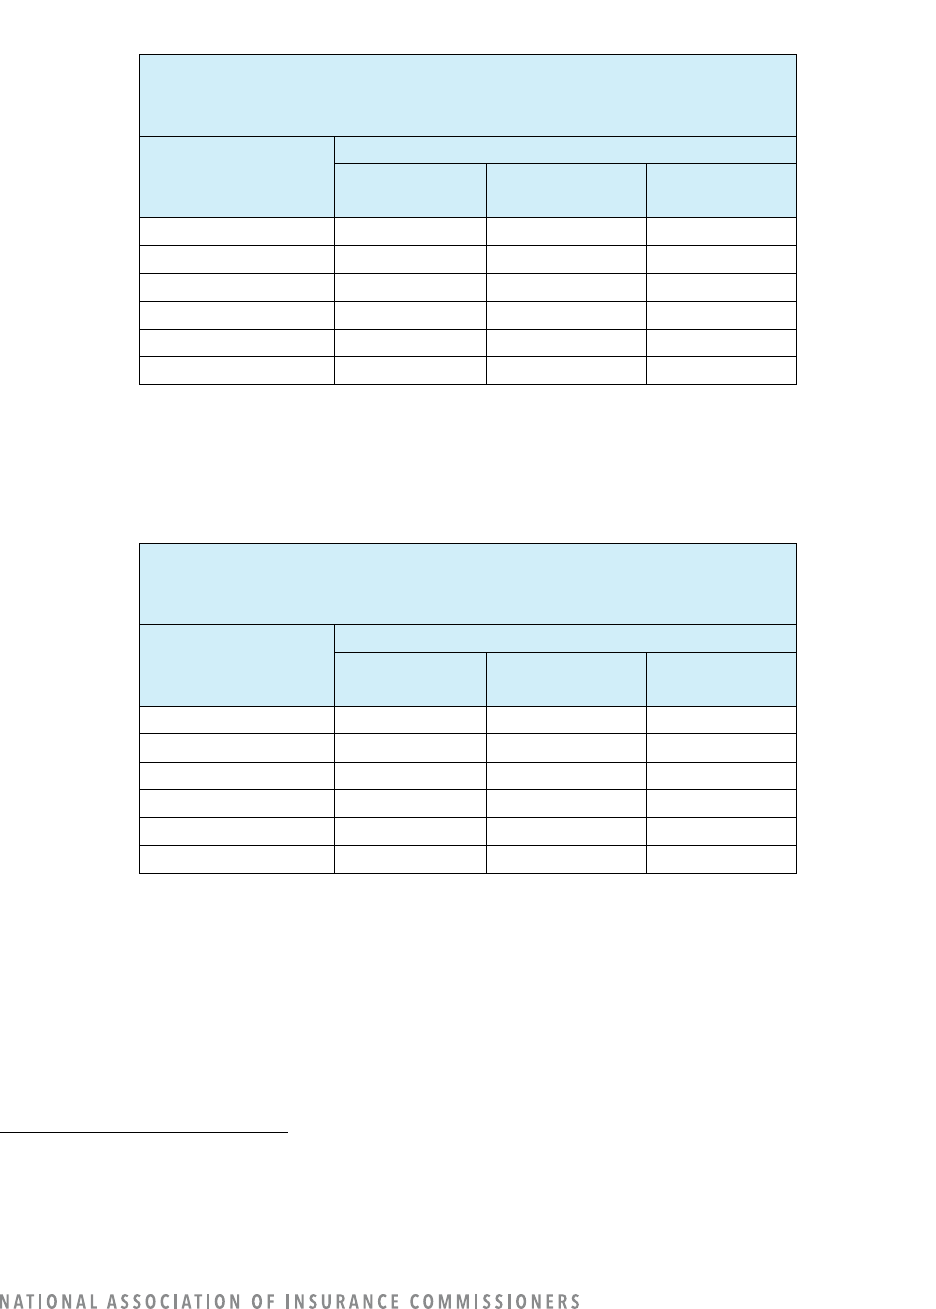
38
company operation area (compared to the “none” and “under construction” column in Table 3). For the
companies that did answer, few said “yes.” (Refer to Table 40 and Table 41.)
Table 40: Companies’ Disclosure to Consumers About the Data Elements by Company Operation Area
Are consumers provided information regarding the data elements
being used? (Answer should be no if not disclosing any information
other than what is required by law.)
Company
Operation
Area
44
Number of Companies
Yes No Blank
Rating
23*
49
121
Underwriting
4
46
143
Claims
0
140
53
Fraud Detection
0
96
97
Marketing
2
87
104
Loss Prevention
0
17
176
*Three of the “yes” responses for rating are models in progress and not yet implemented.
The answer is interpreted as: “When the model is implemented, the answer will be ‘yes.’”
Table 41: Companies’ Disclosure to Consumers About the Purposes of Data Elements by Company
Operation Area
Are consumers provided information regarding the purposes for which
data elements are being used? (Answer should be no if not disclosing
any information other than what is required by law.)
Company
Operation
Area
45
Number of Companies
Yes No Blank
Rating
19*
53
121
Underwriting
0
50
143
Claims
0
139
54
Fraud Detection
0
98
95
Marketing
2
88
103
Loss Prevention
0
16
177
*Three of the “yes” responses for rating are models in progress and not yet implemented.
The answer is interpreted as: “When the model is implemented, the answer will be ‘yes.’”
Most companies also did not answer the next question about whether the company has more consumer
data correction processes than required by the federal Fair Credit Reporting Act (FCRA). The number of
companies not reporting is slightly more than expected, based on the number of companies reporting
non-use of AI/ML or under construction for a particular company operation area. The existence of
consumer data correction opportunities varies by company operation area, but fewer companies have
additional processes than the number that adhere to the FCRA only. (Refer to Table 42.)
44
For definitions, refer to Appendix A: Guidance for Questions in Each Operational Area: Rating, Underwriting, Claims, Fraud
Detection, Marketing, Loss Prevention.
45
For definitions, refer to Appendix A: Guidance for Questions in Each Operational Area: Rating, Underwriting, Claims, Fraud
Detection, Marketing, Loss Prevention.

39
Table 42: Consumers’ Ability to Correct Data by Company Operation Area
Outside of processes required because of FCRA, do consumers have an
opportunity to challenge or correct their specific data?
Company
Operation
Area
46
Number of Companies
Yes No Blank
Rating
35
37
121
Underwriting
23
27
143
Claims
54
77
62
Fraud Detection
15
80
98
Marketing
41
65
87
Loss Prevention
1
15
177
If the company has more than the FCRA for consumers to have an opportunity to challenge or correct
their specific data, the following write-ins explain the process:
Many companies discussed having a dispute process, which ranged from calling the company or agent to
dispute erroneous data to allowing policyholders to correct erroneous data themselves through an app.
In future surveys, it might be useful to ask more detailed questions to determine consumer awareness of
dispute processes and ask companies to provide statistics on how often consumers avail the company
dispute processes to correct erroneous data.
Future surveys might pose one or more of the following questions:
1. How do consumers learn about your customer-dispute processes?
2. Are your customer-dispute processes discussed with consumers at the time of sale?
3. How often do consumers avail themselves of your customer-dispute process on average per year?
4. What aspects of the policies do consumers dispute more, the insurance rate or the data? What data
elements are the most disputed?
5. How do consumers gain access to the data used to calculate their insurance rate?
6. For direct writers, how often on average each year do consumers ask how their insurance rate was
calculated? How much interaction do consumers have with the company?
7. Who explains the calculation to the consumers? Is all the data used in the calculation provided at the
time of the discussion?
Other considerations might include:
• How are companies, on an annual basis, letting customers know about the customer-dispute process?
• If an application is denied, can the customer dispute the denial?
• In third-party claims (when the person making the claim is not the person who bought the policy),
how does the dispute process work?
• Where risk differentiation is used and bias might be present, how is the actuarial justification
explained to customers?
46
For definitions, refer to Appendix A: Guidance for Questions in Each Operational Area: Rating, Underwriting, Claims, Fraud
Detection, Marketing, Loss Prevention.
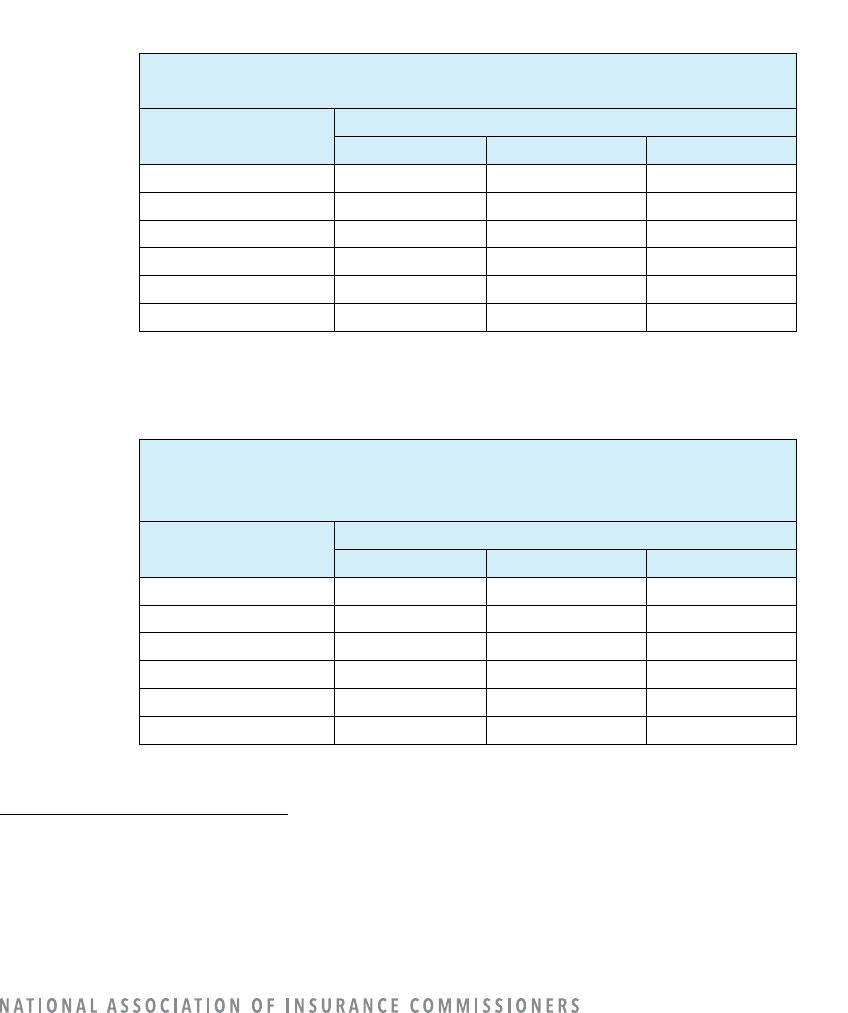
40
GOVERNANCE
47
The purpose of the model governance questions is to obtain a better understanding regarding a
company’s awareness of specific risk areas tied to selected categories in the NAIC’s AI Principles. While
companies may consider a principle, the governance responses represent whether the company has the
principle “documented” within its governance program. (Refer to Tables 43–50.)
A sizable number of companies did not respond to these questions for some company operation areas.
We would expect to find that the number of “blank” answers in Tables 43-50 would be less than or equal
to those in the “under construction” plus “none” columns of Table 3. If companies answered these
questions when expected, the “Blank” column should be less than the following: Rating (141);
Underwriting (159); Claims (58); Fraud Detection (98); Marketing (97); and Loss Prevention (190).
Table 43: Governance Documentation of NAIC AI Principle: Fairness and Ethics Considerations
Are “Fairness and Ethics Considerations”
documented in the governance program?
Company
Operation Area
48
Number of Companies
Yes
No
Blank
Rating
41
9
143
Underwriting
26
16
151
Claims
67
45
81
Fraud Detection
48
31
114
Marketing
38
34
121
Loss Prevention
9
3
181
Table 44: Governance Documentation of NAIC AI Principle: Accountability for Data Algorithms’
Compliance with Laws, as Well as Intended and Unintended Impacts
Are “Accountability for Data Algorithms’ Compliance With Laws,
as Well as Intended and Unintended Impacts”
documented in the governance program?
Company
Operation Area
49
Number of Companies
Yes
No
Blank
Rating
45
5
143
Underwriting
26
16
151
Claims
77
37
79
Fraud Detection
55
24
114
Marketing
44
28
121
Loss Prevention
9
3
181
47
For definitions, refer to Appendix I: Model Governance Definitions.
48
For definitions, refer to Appendix A: Guidance for Questions in Each Operational Area: Rating, Underwriting, Claims, Fraud
Detection, Marketing, Loss Prevention.
49
For definitions, refer to Appendix A: Guidance for Questions in Each Operational Area: Rating, Underwriting, Claims, Fraud
Detection, Marketing, Loss Prevention.
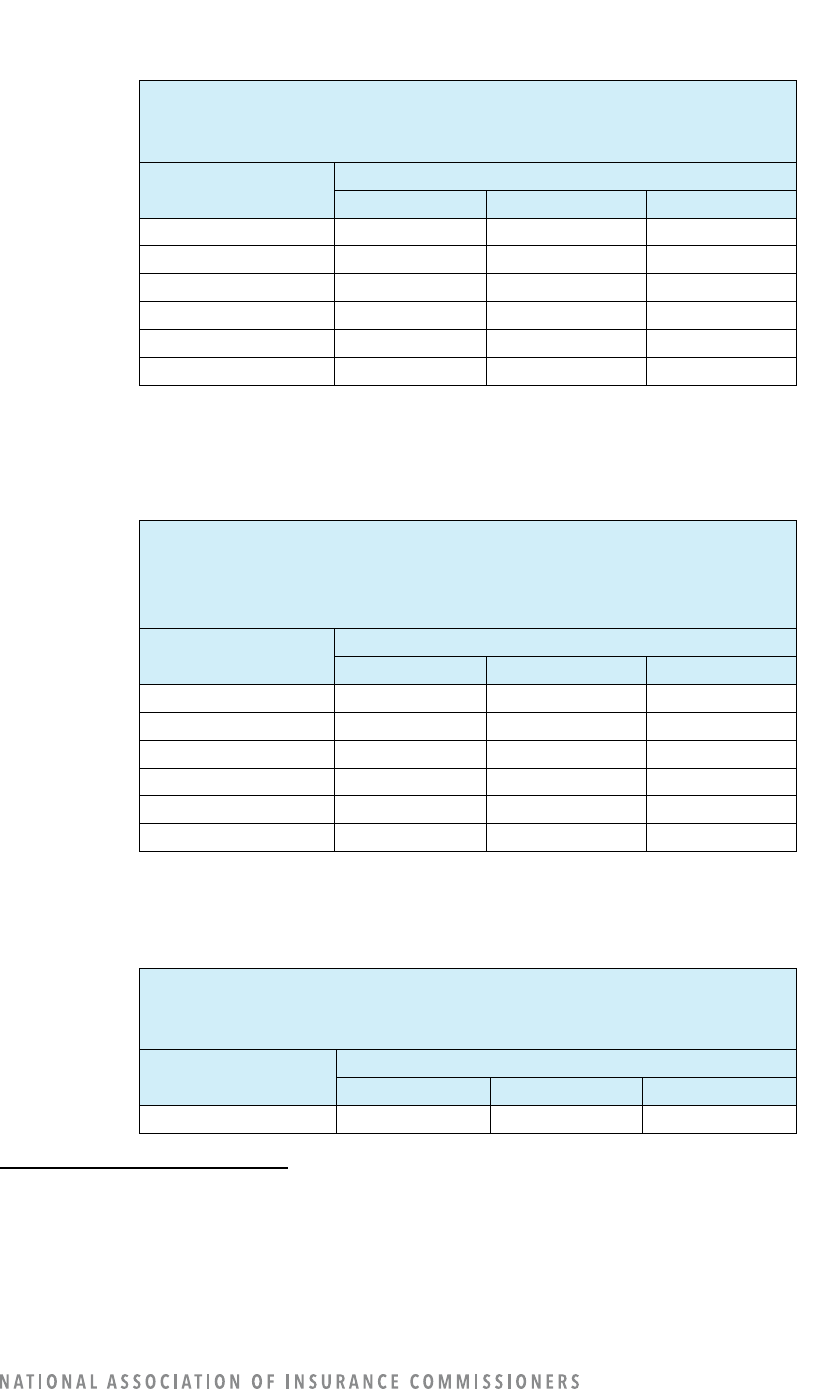
41
Table 45: Governance Documentation of NAIC AI Principle: Appropriate Resources and Knowledge
Involved to Ensure Compliance With Laws, Including Those Related to Unfair Discrimination
Are “Appropriate Resources and Knowledge Involved to Ensure
Compliance With Laws, Including Those Related to Unfair
Discrimination” documented in the governance program?
Company
Operation Area
50
Number of Companies
Yes
No
Blank
Rating
41
9
143
Underwriting
26
16
151
Claims
69
45
79
Fraud Detection
48
31
114
Marketing
38
34
121
Loss Prevention
9
3
181
Table 46: Governance Documentation of NAIC AI Principle: Ensure Transparency With Appropriate
Disclosures, Including Notice to Consumers Specific to Data Being Used and Methods for Appeal and
Recourse Related to Inaccurate Data
Are “Ensure Transparency with Appropriate Disclosures, Including
Notice to Consumers Specific to Data Being Used and Methods for
Appeal and Recourse Related to Inaccurate Data”
documented in the governance program?
Company
Operation Area
51
Number of Companies
Yes
No
Blank
Rating
36
14
143
Underwriting
21
21
151
Claims
57
57
79
Fraud Detection
40
39
114
Marketing
45
27
121
Loss Prevention
8
4
181
Table 47: Governance Documentation of NAIC AI Principle: AI Systems Are Secure, Safe, and Robust
Including Decision Traceability and Security and Privacy Risk Protections
Are “AI Systems Are Secure, Safe, and Robust Including Decision
Traceability and Security and Privacy Risk Protections”
documented in the governance program?
Company
Operation Area
52
Number of Companies
Yes
No
Blank
Rating
44
6
143
50
For definitions, refer to Appendix A: Guidance for Questions in Each Operational Area: Rating, Underwriting, Claims, Fraud
Detection, Marketing, Loss Prevention.
51
For definitions, refer to Appendix A: Guidance for Questions in Each Operational Area: Rating, Underwriting, Claims, Fraud
Detection, Marketing, Loss Prevention.
52
For definitions, refer to Appendix A: Guidance for Questions in Each Operational Area: Rating, Underwriting, Claims, Fraud
Detection, Marketing, Loss Prevention.
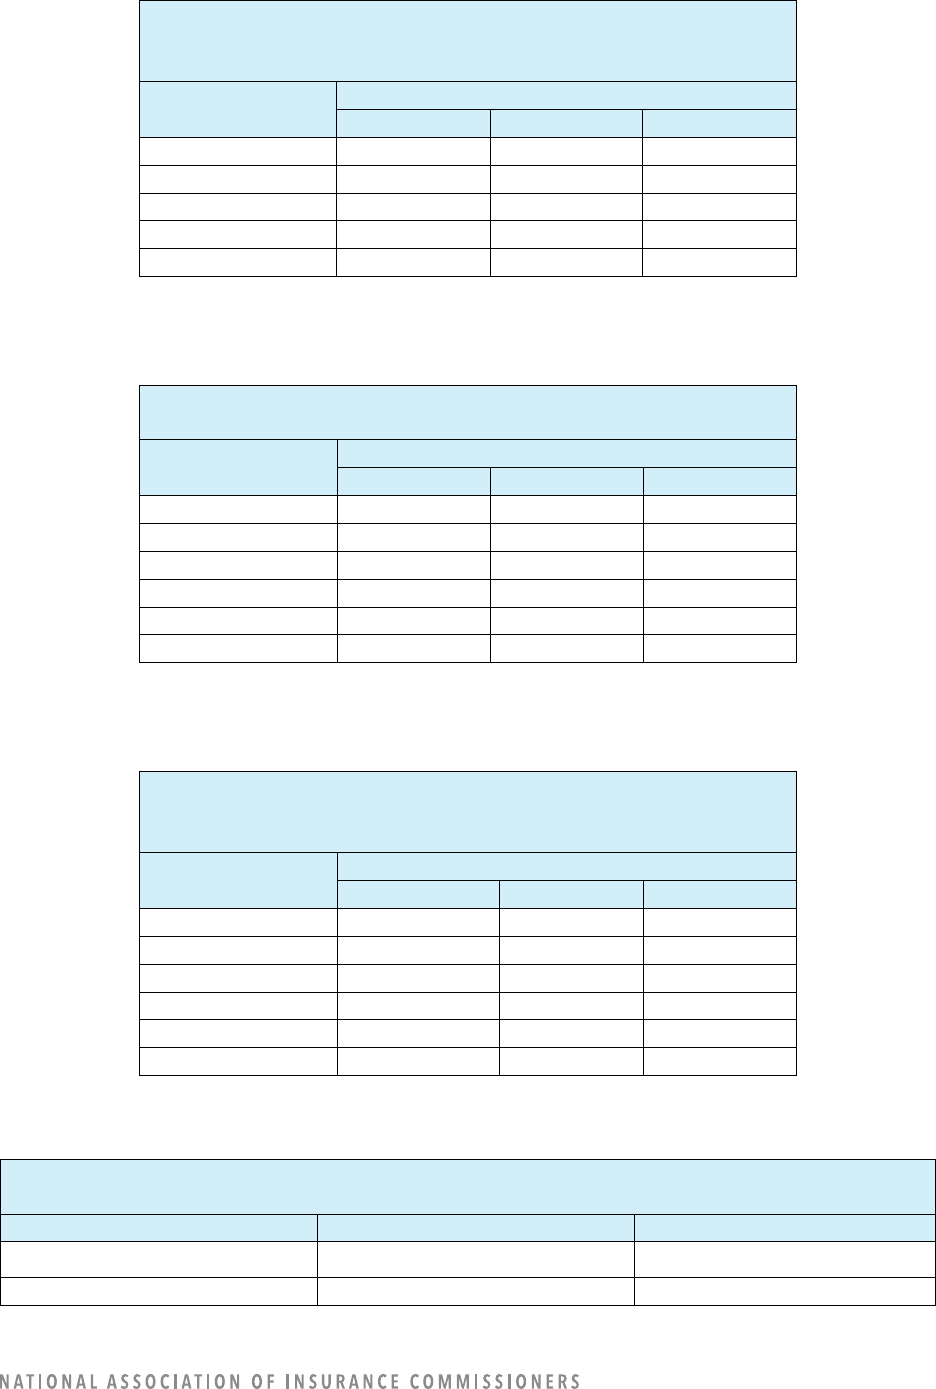
42
Are “AI Systems Are Secure, Safe, and Robust Including Decision
Traceability and Security and Privacy Risk Protections”
documented in the governance program?
Company
Operation Area
52
Number of Companies
Yes
No
Blank
Underwriting
25
17
151
Claims
77
37
79
Fraud Detection
56
23
114
Marketing
42
30
121
Loss Prevention
9
3
181
Table 48: Companies Following “Other” Existing Standards or Guidance in Regard to a Governance
Framework
Do you follow some other existing standards or guidance in regard to
governance framework?
Company
Operation Area
Number of Companies
Yes
No
Blank
Rating
61
11
121
Underwriting
43
6
144
Claims
105
35
53
Fraud Detection
68
22
103
Marketing
60
46
87
Loss Prevention
11
7
175
Table 49: Source (Internal or External) of “Other” Existing Standards or Guidance in Regard to a
Governance Framework
If the company cited it uses “some other existing standards or
guidance in regard to a governance framework,” are the standards
developed internally, provided by a third party, or both?
Company
Operation Area
Number of Companies
Internal
External
Both
Rating
50
5
6
Underwriting
41
0
2
Claims
91
1
13
Fraud Detection
54
1
13
Marketing
53
46
7
Loss Prevention
10
1
0
Table 50: Existing “Other” Standards or Guidance in Regard to a Governance Framework
If the company cited it uses “some other** existing standards or guidance in regard to a
governance framework,” those standards/guidance are:
Company Operation Area
Cited Standard
Number of Times Cited
Rating “All” (Undefined) 5
Underwriting
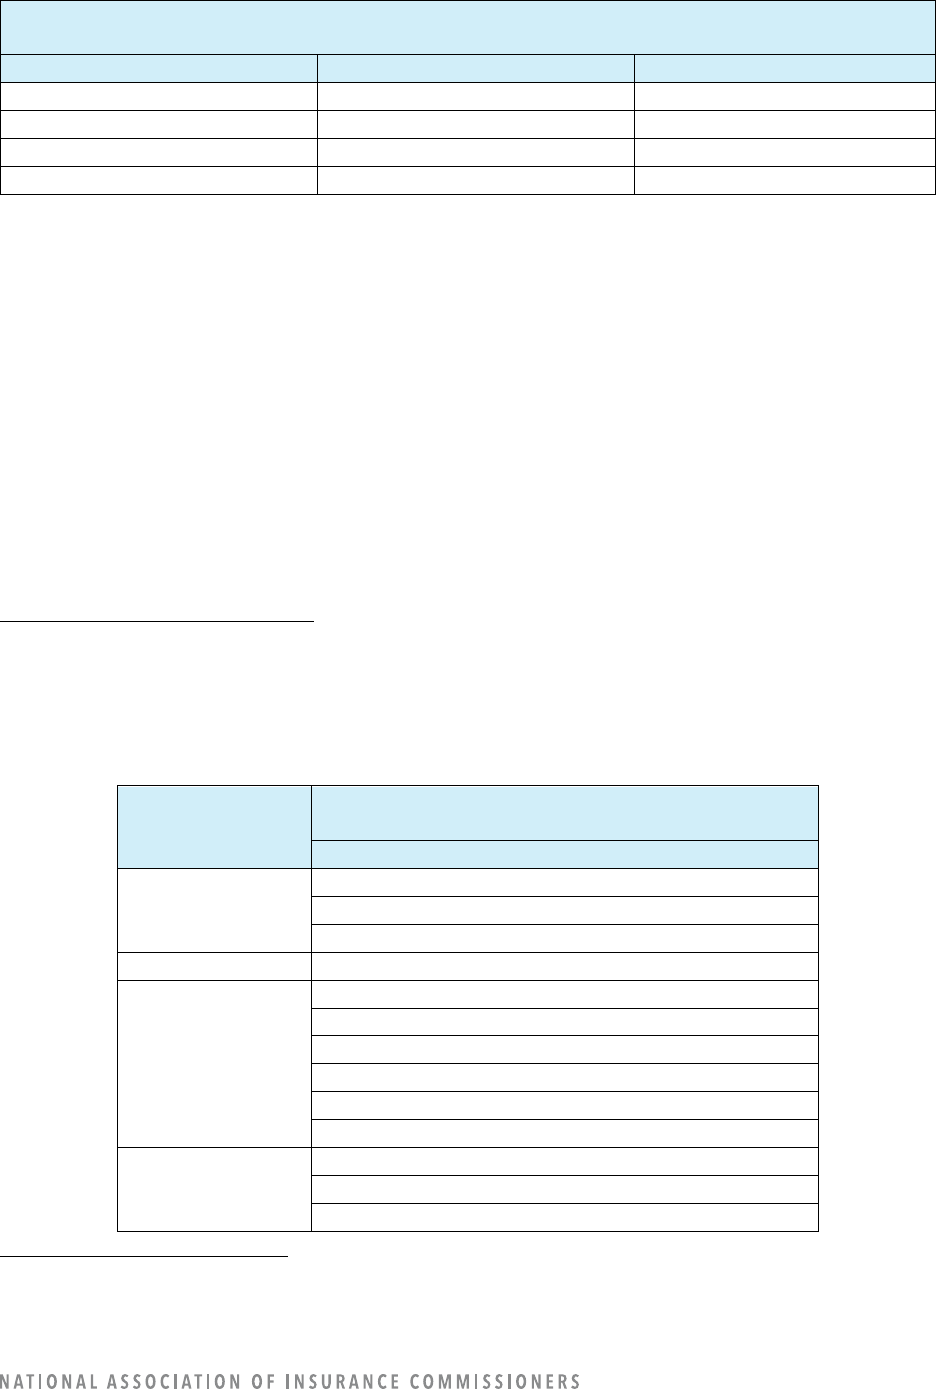
43
If the company cited it uses “some other** existing standards or guidance in regard to a
governance framework,” those standards/guidance are:
Company Operation Area
Cited Standard
Number of Times Cited
Claims
Actuarial Standards of Practice
1
Fraud Detection
Actuarial Standards of Practice
1
Marketing
Loss Prevention
Actuarial Standards of Practice
1
THIRD-PARTY DATA SOURCES AND MODELS
Some AI/ML models being used by companies are developed by third parties. Many of these products are
used by multiple companies. Risks exist that some “off-the-shelf” tools may not be fully understood by
companies and may pose risks to consumers when data is inaccurate. In addition to using third-party
models, companies are using big data from third-party data sources.
There are 2,531 models listed in the survey; 1,073 (42%) are developed by a third party, and 1,458 (58%)
are developed internally. After grouping the similarly named third parties, there are 76 unique third-party
companies listed in the survey whose models are being used by companies. Marketing has 39 different
third parties listed, followed by claims with 28.
There are 104 unique third parties listed as data sources in the survey.
Third-Party Models Used in Claims
Insurers purchased claims models from 28 third-party vendors. Third-party vendors are identified 443
times for claims models. (Refer to Table 51.)
Table 51: Third Parties’ Claims Models Used by Companies
Claims
Model Uses
53
If Model is Developed by a Third Party,
List the Third Party
Third-Party Name
Claim Approval
Optum
Mitchell
Guidewire
Claim Denial
---
Determine
Settlement
Amount
CCC*
Tractable
Mitchell Medical**
CoPart
Medlogix
Colossus
Claim Assignment
Decisions
CCC***
Mitchell
Guidewire
53
For definitions, refer to Appendix A: Guidance for Questions in Each Operational Area: Rating, Underwriting, Claims, Fraud
Detection, Marketing, Loss Prevention.
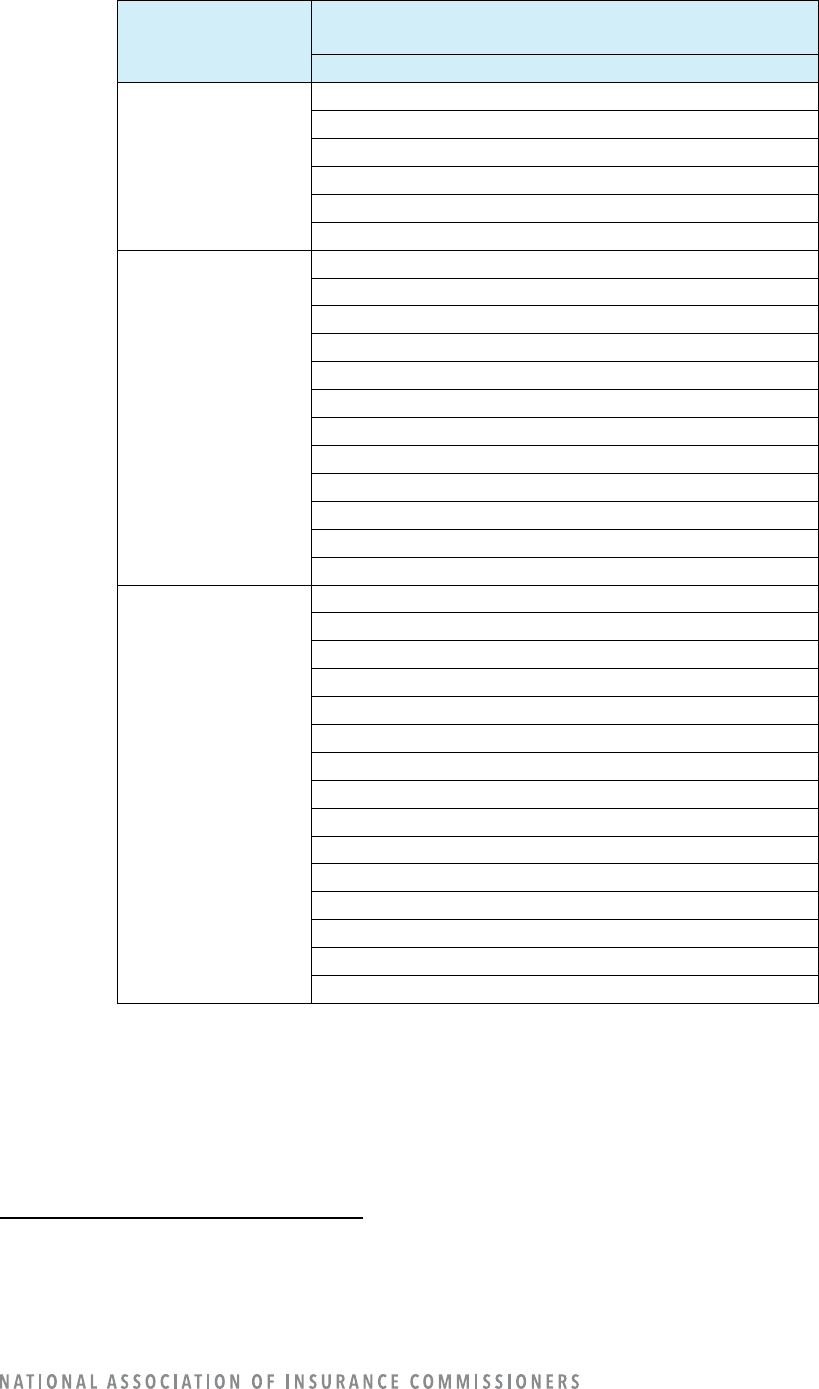
44
Claims
Model Uses
53
If Model is Developed by a Third Party,
List the Third Party
Third-Party Name
Informational
Resources for
Adjustors
EXL
TrueMotion/Cambridge Mobile Telematics
CCC
Infinilytics
Verisk
Assured
Evaluation of
Images of the Loss
CCC****
Tractable
Google
Briefcam Ltd.
Developed by a third party
Auto Glass Inspections Services a.k.a NCS
Amazon Web Services (AWS)
Next Gear Solutions
Mitchell International*****
Claim Genius
Verisk
Shift Technology
Other Claim-
Related Functions
Also developed with AWS
TrueMotion/Cambridge Mobile Telematics******
Cognizant Worldwide Ltd.
Hi Marley
Verisk
Verint
Optum
Five9
Eleveo
Amazon
TBD
Shift Technology
I.P. Soft
CCC
Assured
*Includes CCC Intelligent Solutions.
**Includes Mitchell.
***Includes CCC Information Services Inc. and CCC IS.
****Includes CCC Information Services, CCC Intelligent Solutions, CCC Information Services Inc., CCC Intelligent Systems,
and CCC Intelligent Solutions.
*****Includes Mitchell.
******Includes TrueMotion and True Motion.
Third-Party Data Sources used in Claims
Eleven (11) third parties are used for vehicle-specific data, and eight (8) third parties are used for medical.
45
Table 52: Third-Party Claims Data Element Sources Used by Companies
Claims Data Elements
54
If External or Both, List Each
Data Vendor
Third-Party Name
Criminal Conviction
(Excluding Auto-Related
Convictions)
Carpe Data ClaimsX
Lexis Nexis Claim Datafill
Verisk ISO ClaimSearch
Demographic
LexisNexis
ESRI
EASI (for population density)
Lexis Nexis Claim Datafill
Verisk ISO ClaimSearch
Easi
Shift Technology
Driving Behavior
Lexis Nexis Claim Datafill
Verisk ISO ClaimSearch
Internal Claims data
Motor Vehicle Report
Education
Lexis Nexis Claim Datafill
Vehicle-Specific Data
CCC*
Allant Group
Polk
HLDI
LexisNexis**
Advocates for Highway and Safety
Infinilytics
TransUnion
Verisk ISO ClaimSearch
Internal Policy Data
Shift Technology
Facial Detection/Recognition/
Analysis
---
Geocoding
HR3
PLRB
LexisNexis Claim Datafill
CCC One
Natural Catastrophe
---
Job Stability
---
Income
---
Occupation
---
Personal Financial Information
Lexis Nexis Claim Datafill
54
For definitions, refer to Appendix H: Data Use Table Definitions.
46
Claims Data Elements
54
If External or Both, List Each
Data Vendor
Third-Party Name
Loss Experience
ISO/Verisk
CCC Information Services*
Internal Loss Data
Medical
Mitchell Medical
ABM
CCC
ODG
Provider Information
Claim Director Tool
Next Gear Settle Assist
Verisk ISO ClaimSearch
Online Media
Carpe Data
Telematics
TrueMotion***
Voice Analysis
Amazon
Eleveo
Five9
HiMarley
Verint
Consumer or Other Type of
“Score”
CCC
Tractable
Lexis Nexis Claim Datafill
Verisk ISO ClaimSearch
Other Nontraditional Data
Elements
National Recall Database
News Articles
Shift Technology
Weather Data
*Includes CCC Information Services Inc., CCC Intelligent Solutions, CCC Information Services, CCC IES, CCC Smart Estimate,
CCC Data, CCC One.
**Includes Lexis Nexis Claim Datafill.
***Includes Cambridge Mobile Telematics, CMT.
Third-Party Models Used in Fraud Detection
Insurers purchased fraud detection models from 15 third-party vendors. (Refer to Table 53.)
Table 53: Third Parties’ Fraud-Detection Models Used by Companies
Fraud-Detection
Model Uses
18
If Model is Developed by a Third Party, List the
Third Party
Third-Party Name
Fast-Tracking of Likely
Non-Fraudulent Claims
Shift Technology (Shift)
IBM
Verisk
Not Yet Named
47
Fraud-Detection
Model Uses
18
If Model is Developed by a Third Party, List the
Third Party
Third-Party Name
Guidewire
Referral of Claims for
Further Investigation
Shift Technology (Shift, Shift Technologies)
Developed by a third party
Carpe Data
Verisk
ISO
SAS Institute Inc.
IBM
Not Yet Named
Mitchell
Guidewire
CCC Intelligent Solutions
Detect Medical
Provider Fraud
Shift (Shift Technology, Shift Technologies)
Verisk
SAS Institute Inc.
Detect First-Party
Liability
Shift Technology (Shift Technologies)
SAS, Institute Inc.
IBM
Verisk
Mitchell
Guidewire
Detect Third-Party
Liability
Shift Technology (Shift Technologies)
SAS Institute, Inc.
IBM
Verisk
Mitchell
Guidewire
Other Fraud Detection-
Related Functions
Shape, Neustar, TransUnion
TransUnion
NeuroID
Shift Technology
SkopeNow
PinDrop
Carpe Data
48
Table 54: Third-Party Fraud-Detection Data Element Sources Used by Companies
Fraud-Detection Data Elements
55
If External or Both, List Each
Data Vendor
Third-Party Name
Criminal Conviction
(Excluding Auto-Related Convictions)
NICB*
Shift Technology’s models leverage
the NICB's prosecution and
administrative action convictions
AIS
Shift
TransUnion
Demographic
LexisNexis
Shift Technology**
“Age is used to clear potentially
suspicious cases (e.g., Injuries are
more likely for elderly passengers, so
that can lessen the suspicion of an
injury claim).
Address is used to identify possible
personal relationships in fraud ring
detection.
Gender, marital status, race, etc., are
never used in fraud detection.”
Easy Analytics Software Inc.
Open Source Python Package
uszipcode 0.2.6 (Massachusetts
Institute of Technology [MIT] owns
license)
Driving Behavior
LexisNexis (for driving violations)
Education
---
Vehicle-Specific Data
Verisk – ISO***
CCC
LexisNexis
NICB Forewarn Alerts
CARFAX
Not Yet Named
Shift
TransUnion
Facial Detection/Recognition/Analysis
---
Geocoding
Shift Technology provides geocoding
capabilities as an input into its models
(e.g., calculating distances between
addresses)
IBM
55
For definitions, refer to Appendix H: Data Use Table Definitions.

49
Fraud-Detection Data Elements
55
If External or Both, List Each
Data Vendor
Third-Party Name
Census Bureau
Natural Catastrophe
---
Job Stability
---
Income
---
Occupation
---
Personal Financial Information
TransUnion
Insurance Score
Loss Experience
NICB Questionable Claims****
Verisk*****
Internal Loss Data
Not Yet Named
Medical
AIS
CMS NPI
Internal medical bills
LEIE
Claims Director tool
Shift
Online Media
Shift crawls publicly available social
media activity to detect activity
inconsistent with the facts of
loss******
Carpe Data
SkopeNow
Telematics
---
Voice Analysis
---
Consumer or Other Type of “Score”
LexisNexis
Shift
TLO
Verisk
Other Nontraditional Data Elements
---
*Includes ISO and Verisk/NICB.
**Includes Shift Technology.
***Includes ISO and Verisk.
****Includes NICB Forewarn Alerts, NICB, NICB Questionable Claims, and NICB Questionable Claims.
*****Includes Verisk-ISO, ISO, and ISO Loss Data/Reports.
******Includes Shift.
Third-Party Models Used in Marketing
Marketing is the only operational area in which most models are developed by third parties at 56% with
454 models (vs. 352 developed internally). For targeted online advertising, 186 models were from third
parties compared to 19 models developed internally.
Insurers purchased marketing models from 39 third-party vendors. (Refer to Table 55.)
50
Table 55: Third Parties’ Marketing Models Used by Companies
Marketing
Model Uses
56
If Model is Developed by a Third Party, List the
Third Party
Third-Party Name
Targeted Online
Advertising
Google
Facebook
The Trade Desk
Yahoo
Universal McCann
Pinterest
Ebay
Buzzfeed
BING
Amazon
Google, Microsoft, Facebook
Google, Facebook, LinkedIn
Verizon
Deployed advertising agency
Facebook/Instagram
AT&T
Various display advertising firms
Used by Google for Ad Buying
Used by Google and Facebook for Ad Buying
Transunion
Seismic
Salesforce
LinkedIn
Digital Remedy
Amsive
Acxiom
Identification of
Recipients of Mail
or Phone
Advertising
Merkle
EXL
DataLab
Salesforce
Pegasystems
IBM
Amsive
Ameriprise
Provision of Offers
to Existing
Customers
Merkle
Pegasystems
IBM
Amsive
Merkle
56
For definitions, refer to Appendix A: Guidance for Questions in Each Operational Area: Rating, Underwriting, Claims, Fraud
Detection, Marketing, Loss Prevention.
51
Marketing
Model Uses
56
If Model is Developed by a Third Party, List the
Third Party
Third-Party Name
Identification of
Potential Customer
Groups
Google
The Trade Desk
EXL
Yahoo
Facebook/Instagram
AT&T
TransUnion
Amsive
Acxiom
Demand Modeling
Pegasystems
IBM
Google
Yahoo
Direct Online Sales
Multiple, depends on advertising platform;
e.g., Facebook, Cognitiv
Microsoft
Kibo/Monetate
Google and Bing
Google
Pegasystems
IBM
Other Marketing-
Related Functions
Google, Facebook, LinkedIn
Persado
Xplain
Google, Microsoft, Facebook, LinkedIn
Nielson
Neustar
Marketing Evolution
Rocket Referrals
Qualtrics
PPC Protect
Matlen Silver
Human
Google
Third parties are listed 277 times under marketing. Twenty-three (23) different third parties are used as a
data source for the demographic data element. (Refer to Table 56.)
52
Table 56: Third-Party Marketing Data Element Sources Used by Companies
Marketing Data Elements
57
If External or Both, List Each Data Vendor
Third-Party Name
Criminal Conviction
(Excluding Auto-Related Convictions)
---
Demographic
Acxiom
EASI
DMS
MediaAlpha
Equifax
Facebook
Facebook/Instagram
The Trade Desk*
Xandr
Ameriprise Advisor Information
Amsive
Claritas
Costco
DataLab (uses marketing data to develop
models; unsure of data sources it licenses)
Experian
Google
Google DV360 + YouTube
Lead Provider
LinkedIn
Self-reported information from consumer,
provided by lead aggregators such as
Everquote
TransUnion
Various programmatic display advertising
vendors
Yahoo
Driving Behavior
CARFAX
DMS
MediaAlpha
Lead Provider
TransUnion
Education
Acxiom
DMS
MediaAlpha
Equifax
Amsive
Experian
Google
57
For definitions, refer to Appendix H: Data Use Table Definitions.
53
Marketing Data Elements
57
If External or Both, List Each Data Vendor
Third-Party Name
Lead Provider
Self-reported information from consumer,
provided by lead aggregators such as
Everquote
TransUnion
Yahoo
Vehicle-Specific Data
CARFAX
DMS
MediaAlpha
Acxiom
Google
Lead Provider
Self-reported information from consumer,
provided by lead aggregators such as
Everquote
TransUnion
Yahoo
Facial Detection/Recognition/Analysis
---
Geocoding
Facebook
Google DCM
Google Maps Application Programming
Interfaces (API)
DataLab – uses territory in its models
Lead Provider
LinkedIn
Various programmatic display advertising
vendors
Natural Catastrophe
Lead Provider
Job Stability
---
Income
Equifax
Experian
Google
Google DV360 + YouTube
The Trade Desk
TransUnion
Yahoo
Occupation
Acxiom
Equifax
Facebook
Amsive
Experian
Lead Provider
LinkedIn
Various programmatic display
advertising vendors

54
Marketing Data Elements
57
If External or Both, List Each Data Vendor
Third-Party Name
Personal Financial Information
Credit Bureaus
Trans Union
Acxiom
TransUnion
Amsive
EXL
Experian
Loss Experience
LexisNexis
Lead Provider
Medical
---
Online Media
Acxiom
Google
“Inherent in programmatic display
advertising. We do not have an internal
model, but AI/ML is inherently used in
digital advertising placement, leveraging
online activity.”
Facebook
Google DCM
Social Media
4USocial
Amsive
Bing
Google DV360 + YouTube
LinkedIn
Rocket Referrals
The Trade Desk
Various programmatic display advertising
vendors
Yahoo
Telematics
---
Voice Analysis
---
Consumer or Other Type of “Score”
TransUnion
Acxiom
Equifax
FICO
Zeta
Experian
Facebook Total Value Score
Lead Provider
TransUnion, Equifax (Credit)
Other Nontraditional Data Elements
Ameriprise Advisor Business Information
Experian
TransUnion
*Includes Trade Desk.
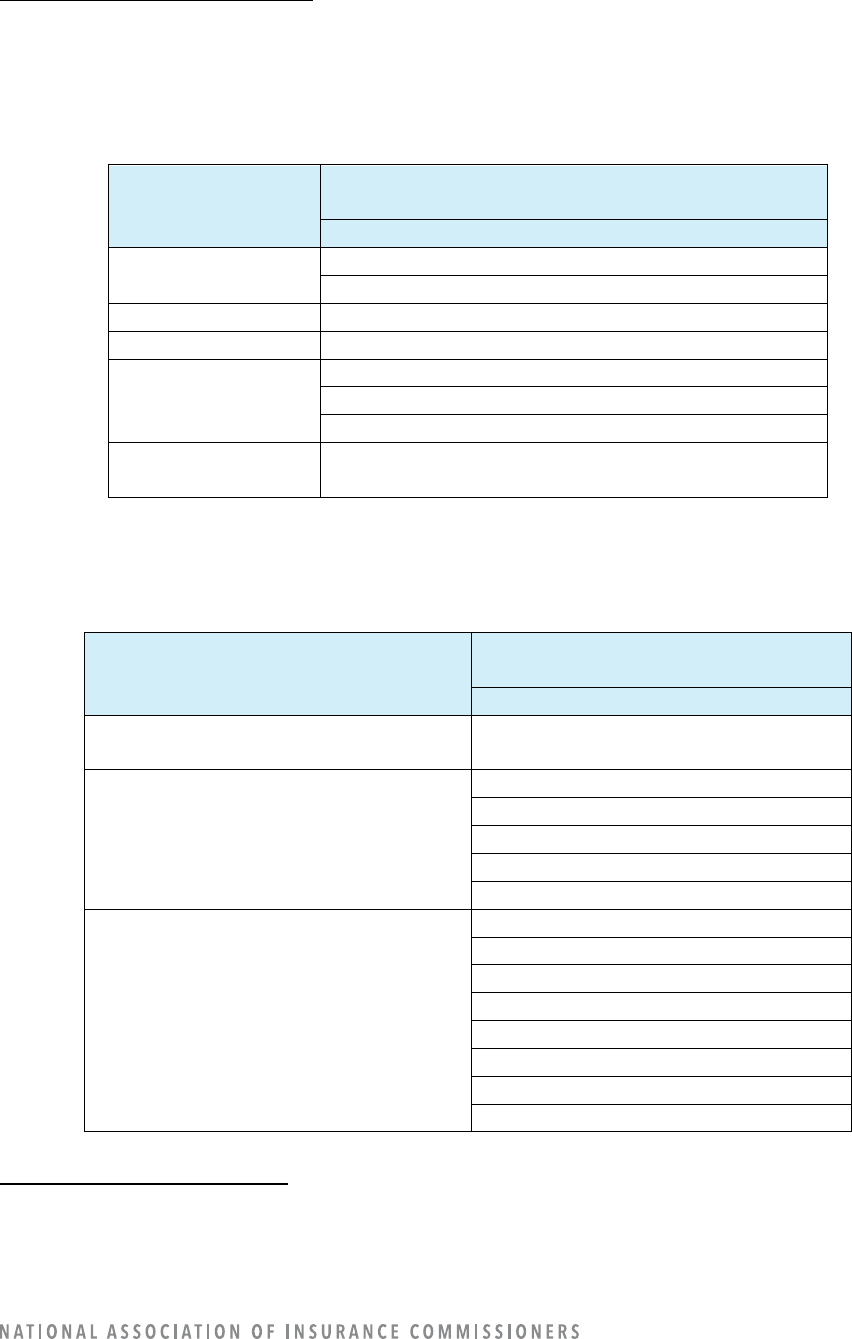
55
Third-Party Models Used in Rating
Insurers purchased “more advanced AI/ML” rating models from three (3) third-party vendors. (Refer to
Table 57.)
Table 57: Third Parties’ Rating Models Used by Companies
Rating Model Uses
58
If Model is Developed by a Third Party, List the
Third Party
Third-Party Name
Rating Class
Determination
Cambridge Mobile Telematics
TransUnion
Price Optimization
---
Retention Modeling
Willis Towers Watson
Numerical Relativity
Determination
TrueMotion (CMT)
Cambridge Mobile Telematics
TransUnion
Other Rate-Related
Functions
Cambridge Mobile Telematics
Third parties are listed 258 times under the “rating” category. (Refer to Table 58.)
Table 58: Third-Party Rating Data Element Sources Used by Companies
Rating Data Elements
59
If External or Both, List Each
Data Vendor
Third-Party Name
Criminal Conviction
(Excluding Auto-Related Convictions)
---
Demographic
EASI
American Community Survey
U.S. Census Bureau
Applied Geographic Solutions
Integrated Public Use Microdata Series
Driving Behavior
CARFAX
LexisNexis
Explore
TransUnion
Cambridge Mobile Telematics
CLUE
TrueMotion
Motor Vehicle Record (MVR)
58
For definitions, refer to Appendix A: Guidance for Questions in Each Operational Area: Rating, Underwriting, Claims, Fraud
Detection, Marketing, Loss Prevention.
59
For definitions, refer to Appendix H: Data Use Table Definitions.
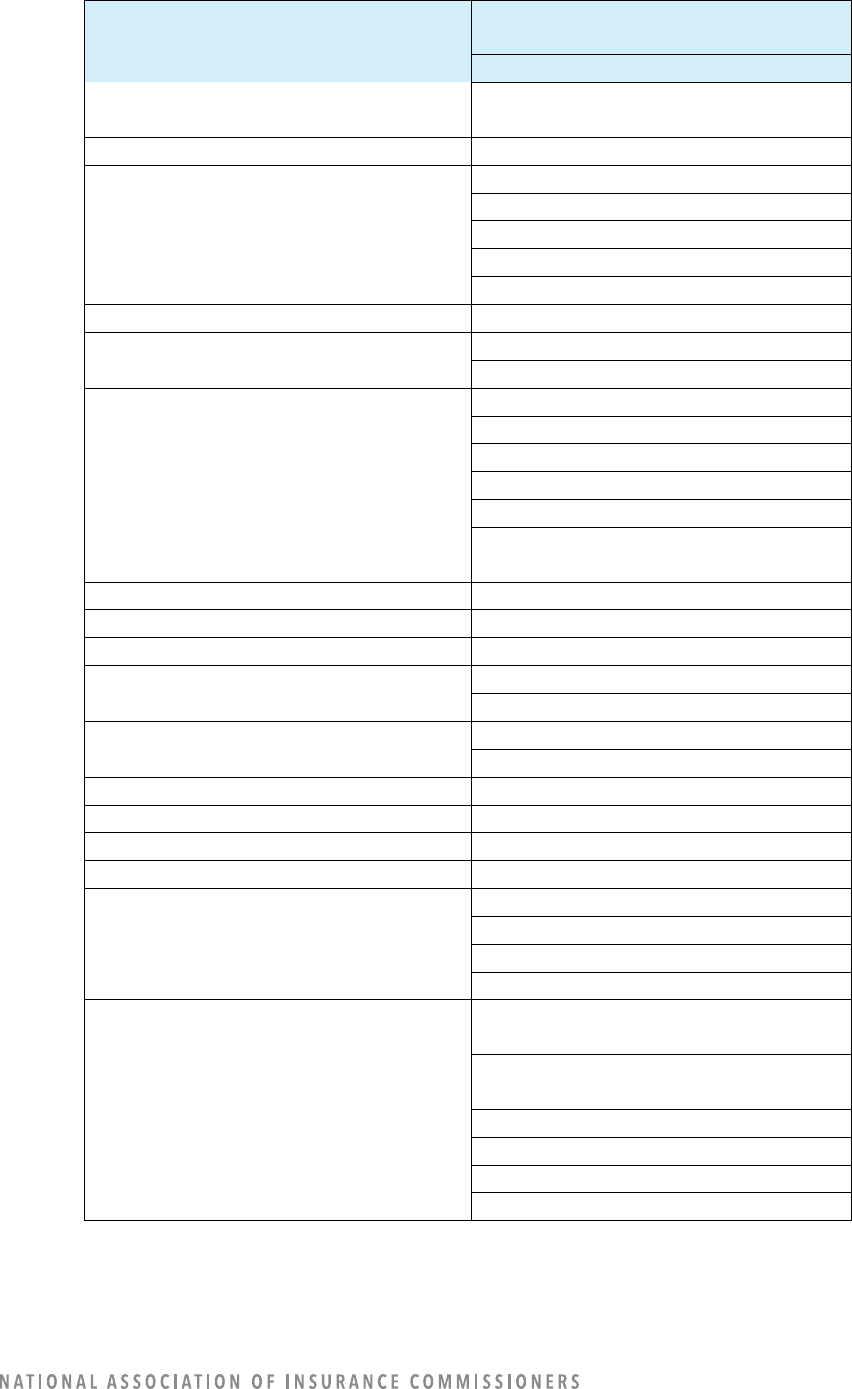
56
Rating Data Elements
59
If External or Both, List Each
Data Vendor
Third-Party Name
State Departments of Motor Vehicles
(DMVs) (MVRs)
Education
---
Vehicle-Specific Data
CARFAX
HLDI*
ISO**
Polk
TransUnion
Facial Detection/Recognition/Analysis
---
Geocoding
Precisely
Pitney-Bowes
Natural Catastrophe
Applied Geographic Solutions
Oak Ridge National Laboratory
Property and Liability Resource Bureau
CoreLogic
Hazardhub
National Oceanic and Atmospheric
(NOAA)
Job Stability
---
Income
---
Occupation
---
Personal Financial Information
LexisNexis
TransUnion
Loss Experience
LexisNexis
CLUE
Medical
---
Online Media
---
Telematics
Cambridge Mobile Telematics***
Voice Analysis
---
Consumer or Other Type of “Score”
Equifax
TransUnion****
LexisNexis
Cambridge Mobile Telematics
Other Nontraditional Data Elements
Environmental Systems Research
Institute (ESRI)
Federal Highway Administration
(FHWA)
Highway Loss Data Institute (HLDI)
Precisely
PRISM Climate Group
United States Geologic Survey (USGS)
*Includes HLDI and HLDI.
**Includes ISO/Verisk and ISO Verisk.
***Includes TrueMotion and CMT.
****Includes TransUnion Credit.
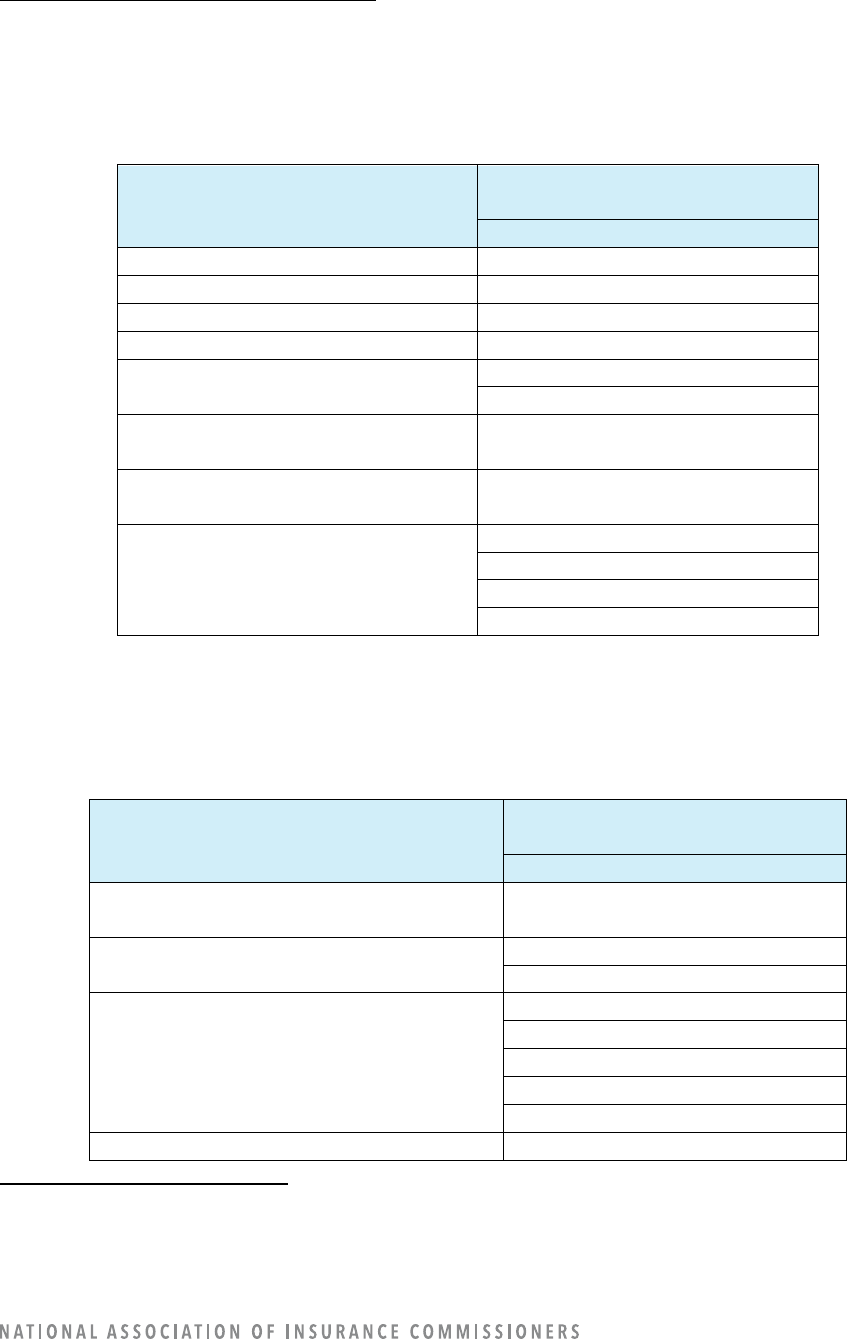
57
Third-Party Models Used in Underwriting
Insurers purchased “more advanced AI/ML” underwriting models from five (5) third-party vendors. (Refer
to Table 59.)
Table 59: Third Parties’ Underwriting Models Used by Companies
Underwriting Model Uses
60
If Model is Developed by a Third-
Party, List the Third Party
Third-Party Name
Automated Approval
Shift Technology
Automated Denial
Shift Technology
Underwriting Tier Determination
---
Company Placement
---
Input Into Non-Automated Approval
Decision
Shift Technology
Verisk
Input Into Non-Automated Denial
Decision
Shift Technology
Automate Processing Through the
Agency Channel
---
Other Underwriting-Related
Functions
Cambridge Mobile Telematics
Shift Technology*
Clyde Analytics
Betterview
*Includes SHIFT.
Third parties are listed 145 times under the “underwriting data elements” category. (Refer to Table 60.)
Table 60: Third-Party Underwriting Data Element Sources Used by Companies
Underwriting Data Elements
61
If External or Both, List Each Data
Vendor
Third-Party Name
Criminal Conviction
(Excluding Auto-Related Convictions)
---
Demographic
EASI
U.S. Census Data Web site
Driving Behavior
Explore
LexisNexis
TransUnion
Cambridge Mobile Telematics
State DMVs, MVR
Education
---
60
For definitions, refer to Appendix A: Guidance for Questions in Each Operational Area: Rating, Underwriting, Claims, Fraud
Detection, Marketing, Loss Prevention.
61
For definitions, refer to Appendix H: Data Use Table Definitions.
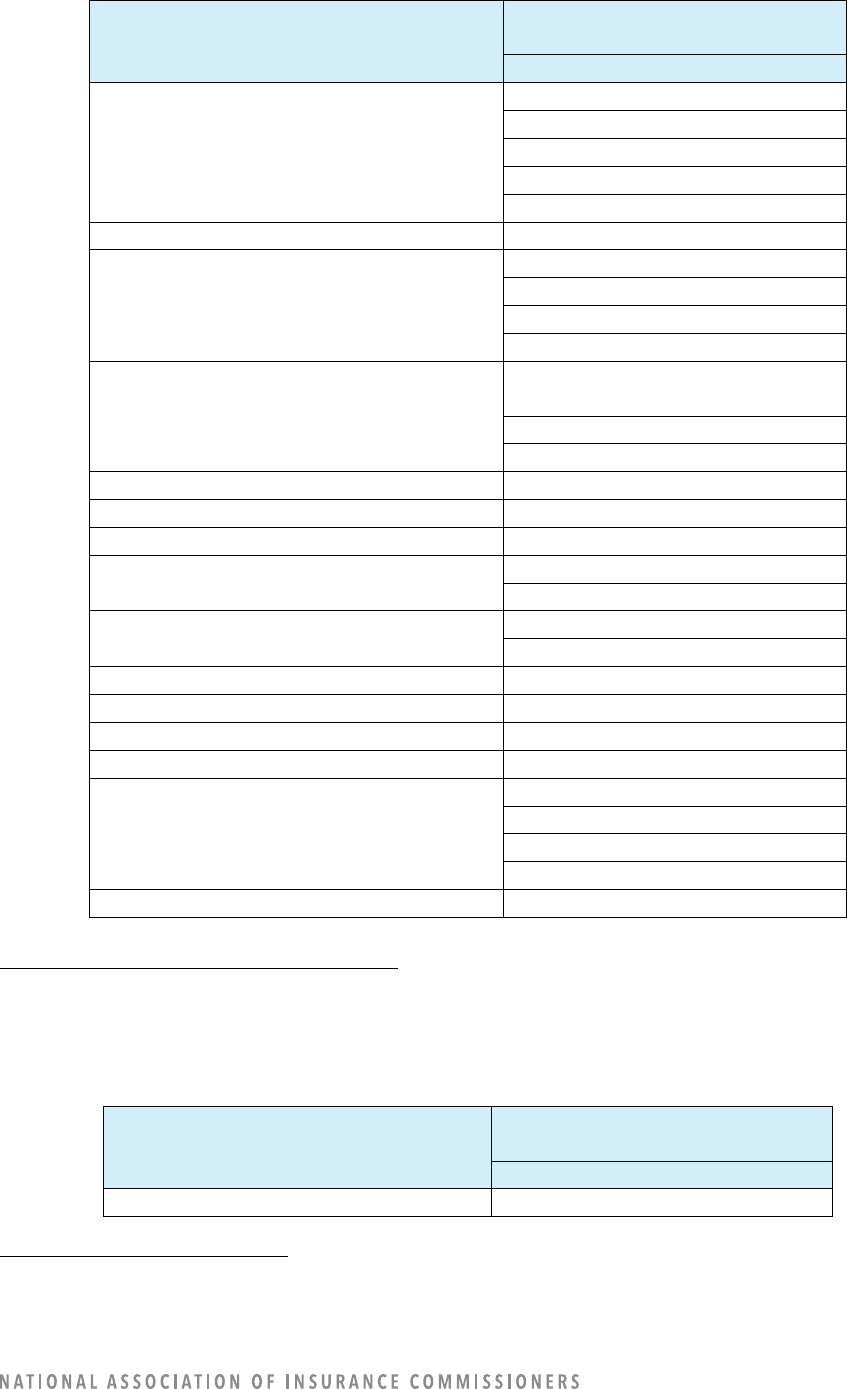
58
Underwriting Data Elements
61
If External or Both, List Each Data
Vendor
Third-Party Name
Vehicle-Specific Data
HLDI (HLDI-1)
ISO
HLDI/CARFAX
Polk
Vehicle Symbol
Facial Detection/Recognition/Analysis
---
Geocoding
Precisely
Claritas
Pitney Bowes
U.S. Census Bureau
Natural Catastrophe
AIR Worldwide (Applied Insurance
Research)
CoreLogic
ISO and NOAA
Job Stability
---
Income
---
Occupation
---
Personal Financial Information
Insurance Score
LexisNexis
Loss Experience
LexisNexis
CLUE
Medical
---
Online Media
---
Telematics
Cambridge Mobile Telematics
Voice Analysis
---
Consumer or Other Type of “Score”
TransUnion
Equifax
LexisNexis
Verisk
Other Nontraditional Data Elements
---
Third-Party Models Used in Loss Prevention
Insurers purchased loss prevention models from two (2) third-party vendors. (Refer to Table 61.)
Table 61: Third Parties’ Loss Prevention Models Used by Companies
Loss Prevention Model Uses
62
If Model is Developed by a Third-
Party, List the Third Party
Third-Party Name
Identification of High-Risk Customers
Flyreel
62
For definitions, refer to Appendix A: Guidance for Questions in Each Operational Area: Rating, Underwriting, Claims, Fraud
Detection, Marketing, Loss Prevention.
59
Shift Technology
Risk-Mitigation Advice to Consumers
---
Determination of Advance Payments
---
Other Loss Prevention-Related Functions
---
Third-Party Models Used in Loss Prevention
The only third party as a data source for loss prevention is Flyreel, which is listed for geocoding. (Refer to
Table 62.)
Table 62: Third-Party Loss Prevention Data Element Sources Used by Companies
Loss Prevention Data Elements
63
If External or Both, List Each Data
Vendor
Third-Party Name
Criminal Conviction
(Excluding Auto-Related Convictions)
---
Demographic
---
Driving Behavior
---
Education
---
Vehicle-Specific Data
---
Facial Detection/Recognition/Analysis
---
Geocoding
Flyreel
Natural Catastrophe
---
Job Stability
---
Income
---
Occupation
---
Personal Financial Information
---
Loss Experience
---
Medical
---
Online Media
---
Telematics
---
Voice Analysis
---
Consumer or Other Type of “Score”
---
Other Nontraditional Data Elements
---
REGULATORS’ ACCESS TO DATA: DASHBOARD
The aggregated survey responses for the PPA AI/ML survey are created in a dashboard and will be made
available to all regulators. The information included is the aggregated data on AI/ML usage in the specific
company operations areas. Detail in the dashboard includes implementation status, how AI/ML is used,
how models are developed, governance, and data elements.
Given the project was conducted under individual states’ market conduct authority, functionality to drill
down to an individual company’s response is not available within the dashboard. Also, due to
63
For definitions, refer to Appendix H: Data Use Table Definitions.

60
confidentiality issues, free-form answers regarding other specific uses within operational areas, names of
models, names of third parties, and processes for customers to correct data are not included in the
dashboard.
CONCLUSION/NEXT STEPS
As requested by the SME group, the NAIC’s technical team completed an analysis of the data submitted
in the PPA AI/ML survey. Insight was gained around the general use of AI/ML by insurance companies,
uses of AI/ML in insurance company operations, data elements and sources used in insurance company
operations, governance frameworks and documentation, consumer data recourse, and third-party
sources for AI/ML models and/or data.
The insight gained from the survey will be used to supplement regulators’ knowledge of the current
regulatory framework around AI/ML, governance, consumers, and third parties and to evaluate whether
any changes should be made to the regulatory frameworks.
The SME group, other regulators, and NAIC staff have identified some potential next steps, including many
activities already in progress. The following list of next steps is not intended to be complete, but it may be
helpful as a starting point for discussions and decision-making about what next steps to take at the NAIC:
• Evaluate the survey analysis and determine whether to further explore the following subjects:
o Company AI/ML model usage and the level of decision-making (i.e., the amount of human
involvement in decision-making).
o Company data elements.
o Companies’ governance frameworks and the documentation of such.
o Consumer data recourse.
o Third-party regulatory framework.
• Create a risk hierarchy to prioritize the need for more model governance and company oversight.
The general concept is that more oversight of a model will be needed as the consumer risk or
impact increases from the modeling or models.
• Evaluate consumer data recourse. Companies report a wide variety of methods for consumers to
evaluate and correct data used by companies. Some methods are short and easy, such as using
an app to correct data, and other methods are more time consuming and require personal contact
with the agent or company. In some cases, consumers may not even know about their data being
used, so consumer transparency is a priority. (Privacy Protections (H) Working Group)
• Evaluate the regulatory framework around the use of third-party models and third-party data.
Evaluate the ability of companies and regulators to obtain needed information from third parties
and for regulators to oversee this work either through the companies or third parties in some
way. (Workstream Two of the Big Data and Artificial Intelligence (H) Working Group)
• Evaluate concerns about third-party concentration by company use. (Workstream Two of the Big
Data and Artificial Intelligence (H) Working Group)
• Determine whether additional best-practices white papers would be useful on subjects in the
AI/ML space.

61
APPENDIX A: Guidance for Questions in Each Operational Area: Rating, Underwriting, Claims, Fraud
Detection, Marketing, Loss Prevention
The respondent will only need to complete the corresponding sections for which artificial intelligence
(AI)/machine learning (ML) is being used by their company as indicated in the “General Section of the
Survey.”
For the purposes of this survey, the operational areas are: rating, underwriting, claims, fraud detection,
marketing, and loss prevention. This survey is primarily focused on consumer-facing models used for these
operational areas. However, the respondent can include other operational areas listed in the “other” line
(question 3) in the “General” section of the survey.
Each operational area has specific uses listed for AI/ML. For example, “Rating Class determination is a use
listed under the “Rating” section. The respondent should select the highest level of deployment of AI/ML.
• Research: This is the investigation into and study of materials and sources to establish facts and reach
new conclusions, as well as the collection of information about a particular subject.
• Proof of Concept (POC): The POC is a small exercise to test the design idea or assumption. The main
purpose of developing a POC is to demonstrate the functionality and to verify that a certain concept or
theory can be achieved in development. It is testing the model for functional viability to be sure it runs
and delivers a result.
• Prototype: Prototyping provides the opportunity to visualize how the product will function; it is a
working interactive model of the end product that gives an idea of the design, navigation, and layout.
Prototyping involves testing the model with actual data, in a limited, controlled environment. A prototype
brings the POC idea to life.
• Implemented in Production: The model is being used in a live, production environment using real data.
In addition to the highest level of deployment, the survey seeks information on the level of decisions
influenced by an AI/ML model.
• Automation: There is no human intervention on execution.
• Augmentation: The model advises the human, who makes a decision; the model suggests an answer.
• Support: The model provides information but does not suggest decision or action.

62
APPENDIX B: Definitions Specific to Claims
• Claim Approval: Approving a claim without human intervention on that particular claim.
• Claim Denial: Denying a claim without human intervention on that particular claim.
• Determine Settlement Amount: Recommending which amount to offer to a claimant in order to resolve
the company’s obligations on the claim.
• Claim Assignment Decisions: Recommending which adjusters are assigned to which claims.
• Informational Resource for Adjusters: Providing facts, data, and analysis to claim adjusters without
recommending a decision or limiting the adjusters’ authority over handling the claim.
• Evaluation of Images of the Loss: Analysis of photographic, video, or other visual evidence pertaining to
a potentially insured loss in order to extract facts relevant to a company’s decision and/or provide
guidance and recommendations based on the information obtained in this manner.

63
APPENDIX C: Definitions Specific to Fraud Detection
• Fast Tracking of Likely Non-Fraudulent Claims: For claims that are identified to be at a low risk of fraud,
establishing a rapid process for approving and paying those claims without further scrutiny or follow-up
with the claimant.
• Referral of Claims for Further Investigation: For claims that are identified to be at a higher risk of fraud
or other potential issues that affect the legitimacy of those claims, determining that those claims should
be assigned to investigators for a more intensive and human-driven review process.
• Detect Medical Provider Fraud: Identification of claims where medical providers may have submitted
inappropriate or questionable amounts for reimbursement.
• Detect First-Party Liability: Identification of potential situations where a first-party insured may have
been at fault for a claim and/or may have misrepresented information to the company.
• Detect Third-Party Liability: Identification of potential situations where a third-party claimant may have
been at fault for a claim and/or may have misrepresented information to the company.

64
APPENDIX D: Definitions Specific to Marketing
Definitions Specific to Marketing
• Targeted Online Advertising: Determination of which individuals on the Internet should receive or see
advertisements from the company.
• Identification of Recipients of Mail or Phone Advertising: Determination of which individuals would be
desirable recipients of a company’s advertisements via the telephone or physical mail.
• Provision of Offers to Existing Customers: Determination of which customers should be notified of new
insurance products, discounts, options to be written in a different book of business, or any other benefit
or favorable treatment that the company seeks to extend.
• Identification of Potential Customer Groups: Determination regarding which consumer subpopulations
could become additional likely customers of the company and/or benefit from the company’s products
and services.
• Demand Modeling: Identification of consumers’ needs for and interest in specific types of insurance and
insurance products that the company is offering or whose development or sale the company may be
considering or exploring.
• Direct Online Sales: Selling insurance policies to consumers through a direct Internet-based channel in
a manner that does not rely solely on preprogrammed decision rules.

65
APPENDIX E: Definitions Specific to Rating
Definitions Specific to Rating
• Rating Class Determination: Decisions regarding which insureds to place within which rating category
and which criteria to use to establish a given rating category.
• Price Optimization: NAIC Casualty and Actuarial Statistical (C) Task Force white paper:
https://content.
naic.org/sites/default/files/inline-files/committees_c_catf_related_price_optimization_white_paper.pdf
• Retention Modeling: Estimation of the effects of a particular company-initiated rate change on the
decisions of existing insureds to remain with the company.
• Numerical Relativity Determination: Decisions regarding which quantitative rating factor to assign to a
particular rating category.

66
APPENDIX F: Definitions Specific to Underwriting
• Automated Approval: Approving an application without human intervention on that particular
application.
• Automated Denial: Denying an application without human intervention on that particular application.
• Underwriting Tier Determination: Decisions regarding the criteria to use to establish specific named or
numbered categories (called tiers) that use combinations of attributes that affect a company’s
underwriting decision.
• Company Placement: Decisions regarding which of several affiliated companies within an insurance
group will accept an individual risk.
• Input Into Non-Automated Approval Decision: Providing data, analysis, or recommendations regarding
a decision to approve an application in a situation where a human decision-maker still has the ability and
responsibility to affirmatively consider this information and make a decision independently of the artificial
intelligence (AI)/machine learning (ML) system. In this situation, the AI/ML system cannot automatically
approve the application, and protocols exist that ensure that each recommendation from the AI/ML
system is actively reviewed and not adopted by default.
• Input Into Non-Automated Denial Decision: Providing data, analysis, or recommendations regarding a
decision to deny an application in a situation where a human decision-maker still has the ability and
responsibility to affirmatively consider this information and make a decision independently of the AI/ML
system. In this situation, the AI/ML system cannot automatically deny the application, and protocols exist
that ensure that each recommendation from the AI/ML system is actively reviewed and not adopted by
default.
• Automate Processing Through the Agency Channel: Enabling agencies to receive certain information
about applicants automatically without specifically requesting that information and/or to provide quotes
to the applicants and/or recommend a decision regarding the application to the agent without being
based on preprogrammed decision rules.

67
APPENDIX G: Definitions Specific to Loss Prevention
• Identification of High-Risk Customers: The goal of such identification in a loss-prevention context is not
to make an underwriting or rating decision, but rather to recognize which specific customers may benefit
most from loss-prevention advice and mitigation techniques that the company may be able to provide,
thereby reducing such customers’ frequency and/or severity of losses. For example, an artificial
intelligence (AI)/machine learning (ML) system might determine that certain households with youthful
drivers are more likely to benefit from risk-mitigation advice and other approaches.
• Risk-Mitigation Advice to Consumers: AI/ML systems might be used to target messaging to consumers
based on specific risks identified for a given policy. For example, in a household with youthful drivers,
AI/ML-targeted messaging and incentives could focus on ways those drivers could gain experience in a
low-risk manner and drive more carefully in day-to-day context. For households in mountainous areas,
AI/ML systems could provide targeted advice about safe driving in rugged terrain.
• Determination of Advance Payments: In many situations, small payments issued at or shortly after the
time of loss, prior to the full adjustment of the claim, can help the insured or third-party claimant prevent
much larger amounts of damage that would otherwise greatly raise the costs of the claim for the company.
In a private passenger automobile (PPA) context, examples could include, but are not limited to:
o Making a payment for minor repairs that restore the vehicle to a drivable condition, whereas the
insured and/or company would have otherwise needed to spend much more money to rent
another vehicle or to pay for storage of a non-functional vehicle.
o Making a payment for prompt, inexpensive medical treatment of a claimant, which could prevent
the emergence of a longer-term, chronic, and much more costly health condition.
o Making a payment for expenses related to towing an insured’s or claimant’s vehicle away from
the scene of the accident and reasonable costs of storage for the vehicle until the company or
vehicle owner is able to gain possession of the vehicle. In the absence of such prompt payments,
vehicles at towing-company storage yards may accumulate significant charges for which the
company may ultimately become responsible.

68
APPENDIX H: Data Use Table ("Data Elements") Definitions
1. Consumer or Other Type of “Score”: A numeric value generated based on a combination of any
underlying attributes or behaviors of the consumer, insured risk, or any items considered by the company
to be relevant to the consumer or insured risk. Scores are computed using deterministic algorithms or
models that are not themselves considered to be artificial intelligence (AI)/machine learning (ML) systems.
Inquiries in this survey regarding such scores seek to understand whether these scores are used as input
data elements within AI/ML systems.
2. Criminal Convictions: Exclude auto-related convictions.
3. Demographic: Age, gender, address, marital status, other non-behavioral attributes of a consumer, or
population attributes of an area.
4. Driving Behavior: Tickets, years of driving experience, or annual miles driven.
5. Education: Level of education or GPA.
6. Vehicle-Specific Data: Type of vehicle(s) driven or owned, history of the vehicle(s), or value of contents
inside the car.
7. Facial Detection/Recognition/Analysis: Picture to confirm identity, estimate biological age, or gender of
the consumer.
8. Geocoding: Latitude and longitude coordinates of a physical address.
9. Natural Catastrophe Hazard: Frequency and severity of natural hazards.
10. Job Stability: Current employment, length of employment at prior employers, or unemployment.
11. Income: Annual income or income source.
12. Occupation: Primary profession, service, or trade for which a person is paid.
13. Personal Financial Information: Net worth, type of bank account or credit account, number of bank
accounts or credit accounts, available credit, or payment history data.
14. Loss Experience: Claim history for private passenger auto (PPA) or claims from other lines of insurance.
15. Medical: Medical history, medical condition, prescription data, or lab data.

69
APPENDIX I: Model Governance Definitions
The purpose of the question related to model governance is to obtain a better understanding regarding a
company’s awareness of specific risk areas tied to the NAIC’s Artificial Intelligence (AI) Principles. In
addition, the survey seeks information to understand if guidelines and/or best practices are documented.
Specifically, if the company is involved in using AI/machine learning (ML) models, does the company have
a documented process in place that addresses:
• Fairness and Ethics Considerations: Ensuring responsible adherence to fairness and ethical
considerations. It is clear there is debate regarding the definition of “fairness and ethics,” so for the
purposes of this survey, and assuming a general understanding of the terms, the response should be
consistent with how the company defines those terms. Generally, respect the rule of law and implement
trustworthy solutions designed to benefit consumers in a manner that avoids harmful or unintended
consequences including unfair or proxy discrimination.
• Accountability for Data Algorithms’ Compliance with Laws as Well as Intended and Unintended Impacts:
Ensuring the data used and the algorithms/models within the scope of the AI/ML system are delivering
the intended benefit, and there are proactive processes in place to ensure there is no unacceptable
unintended impact. Simply put, be responsible for the creation, implementation, and impacts of any AI
system.
• Appropriate Resources and Knowledge Involved to Ensure Compliance with Laws, Including Those
Related to Unfair Discrimination: Ensuring the requisite and appropriate resources, skill sets, and
knowledge needed to ensure compliance with laws, including those related to unfair discrimination, are
actively involved in these programs and decision-making
—including oversight of third parties’
understanding and competence related to compliance with relevant laws and the issue of unfair
discrimination.
• Ensure Transparency With Appropriate Disclosures, Including Notice to Consumers Specific to Data
Being Used and Methods for Appeal and Recourse Related to Inaccurate Data: Ensuring documented
processes and best practices are in place that govern and actively address the issue of transparency,
ensuring adequate and complete/understandable consumer disclosure regarding the data being used and
how the data is used, as well as providing a way for consumers to appeal or correct inaccurate data. This
is intended to be specific for data not already protected by legislation such as the federal Fair Credit
Reporting Act (FCRA), as the assumption is all companies would be compliant with that law. This pertains
to consumer data not specified in the FCRA.
• AI Systems are Secure, Safe, and Robust, Including Decision Traceability and Security and Privacy Risk
Protections: Ensuring an appropriate governance process is in place and documented specific to the
company’s AI/ML activity or program that focuses on protecting security, in terms of its data and
intellectual property, from potentially compromising interference or risk and relevant and necessary
privacy protections are in place. Ensuring the data and the AI/ML models are sufficiently transparent and
explainable so that they can be reviewed for compliance with laws and best practices and proven to not
be unfairly discriminatory or used for an unethical purpose.
It is understood that governance models vary in terms of components and terms used to describe these
risk areas. However, there is a common thread across most governance models, and this language was
specifically used in this survey as it ties directly to the NAIC’s AI Principles. Where there may be concerns

70
about overlap, the intention is for this additional information to clarify the unique intent of each. The
company should reply to each component as specifically as possible.
